
SAIC has gotten torched over the last six months - since May 2025, its stock price has dropped 23.4% to $91.70 per share. This may have investors wondering how to approach the situation.
Is now the time to buy SAIC, or should you be careful about including it in your portfolio? Dive into our full research report to see our analyst team’s opinion, it’s free for active Edge members.
Why Do We Think SAIC Will Underperform?
Despite the more favorable entry price, we're cautious about SAIC. Here are three reasons we avoid SAIC and a stock we'd rather own.
1. Long-Term Revenue Growth Disappoints
A company’s long-term sales performance is one signal of its overall quality. Any business can experience short-term success, but top-performing ones enjoy sustained growth for years. Unfortunately, SAIC’s 2.2% annualized revenue growth over the last five years was sluggish. This fell short of our benchmarks.

2. Revenue Projections Show Stormy Skies Ahead
Forecasted revenues by Wall Street analysts signal a company’s potential. Predictions may not always be accurate, but accelerating growth typically boosts valuation multiples and stock prices while slowing growth does the opposite.
Over the next 12 months, sell-side analysts expect SAIC’s revenue to drop by 2.3%, close to its 2.2% annualized growth for the past five years. This projection is underwhelming and suggests its newer products and services will not catalyze better top-line performance yet.
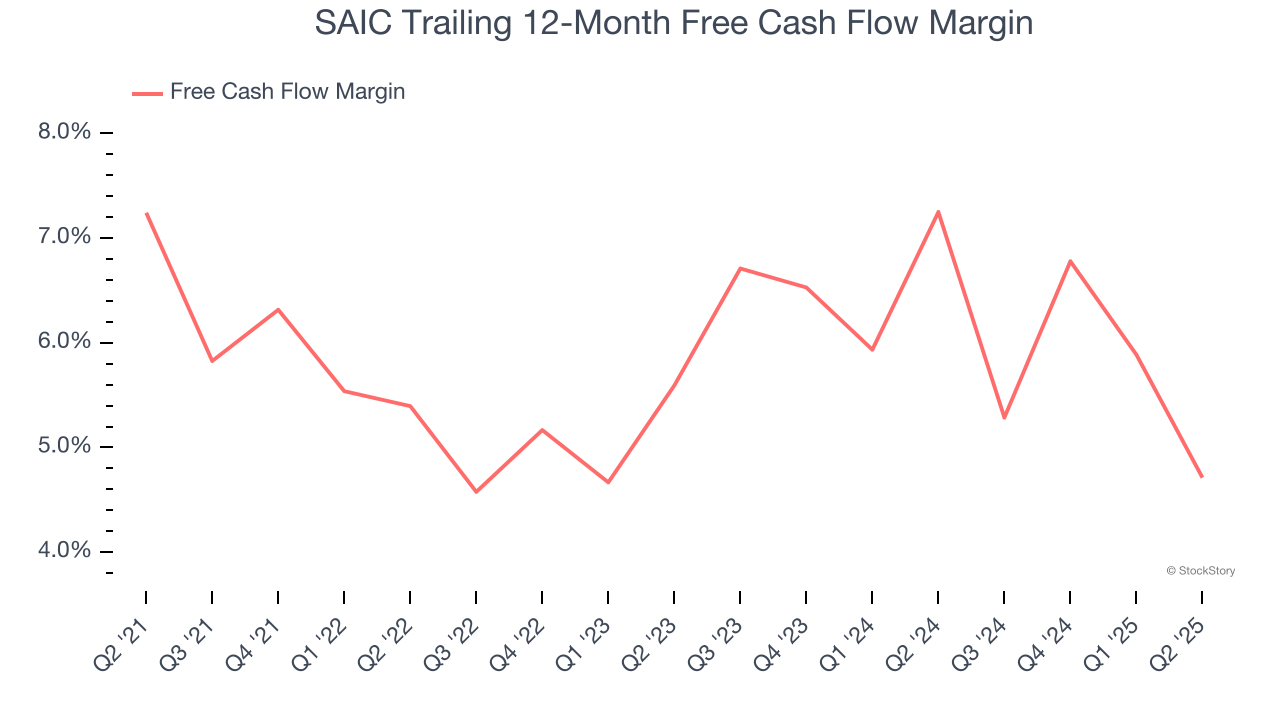
3. Free Cash Flow Margin Dropping
If you’ve followed StockStory for a while, you know we emphasize free cash flow. Why, you ask? We believe that in the end, cash is king, and you can’t use accounting profits to pay the bills.
As you can see below, SAIC’s margin dropped by 2.5 percentage points over the last five years. If its declines continue, it could signal increasing investment needs and capital intensity. SAIC’s free cash flow margin for the trailing 12 months was 4.7%.
Final Judgment
SAIC doesn’t pass our quality test. Following the recent decline, the stock trades at 10.7× forward P/E (or $91.70 per share). This multiple tells us a lot of good news is priced in - you can find more timely opportunities elsewhere. Let us point you toward one of Charlie Munger’s all-time favorite businesses.
Stocks We Like More Than SAIC
Fresh US-China trade tensions just tanked stocks—but strong bank earnings are fueling a sharp rebound. Don’t miss the bounce.
Don’t let fear keep you from great opportunities and take a look at Top 6 Stocks for this week. This is a curated list of our High Quality stocks that have generated a market-beating return of 183% over the last five years (as of March 31st 2025).
Stocks that made our list in 2020 include now familiar names such as Nvidia (+1,545% between March 2020 and March 2025) as well as under-the-radar businesses like the once-micro-cap company Tecnoglass (+1,754% five-year return). Find your next big winner with StockStory today.
StockStory is growing and hiring equity analyst and marketing roles. Are you a 0 to 1 builder passionate about the markets and AI? See the open roles here.


