
Work management platform monday.com (NASDAQ: MNDY) beat Wall Street’s revenue expectations in Q3 CY2025, with sales up 26.2% year on year to $316.9 million. On the other hand, next quarter’s revenue guidance of $329 million was less impressive, coming in 1.4% below analysts’ estimates. Its non-GAAP profit of $1.16 per share was 32.5% above analysts’ consensus estimates.
Is now the time to buy monday.com? Find out by accessing our full research report, it’s free for active Edge members.
monday.com (MNDY) Q3 CY2025 Highlights:
- Revenue: $316.9 million vs analyst estimates of $312.4 million (26.2% year-on-year growth, 1.4% beat)
- Adjusted EPS: $1.16 vs analyst estimates of $0.88 (32.5% beat)
- Adjusted Operating Income: $47.48 million vs analyst estimates of $35.52 million (15% margin, 33.7% beat)
- Revenue Guidance for Q4 CY2025 is $329 million at the midpoint, below analyst estimates of $333.8 million
- Operating Margin: -0.8%, up from -10.9% in the same quarter last year
- Free Cash Flow Margin: 28.5%, up from 21.4% in the previous quarter
- Customers: 3,993 customers paying more than $50,000 annually
- Net Revenue Retention Rate: 115%, in line with the previous quarter
- Market Capitalization: $9.77 billion
“We delivered our highest ever non-GAAP operating profit this quarter, underscoring our focus on efficient, profitable growth,” said Eliran Glazer, monday.com CFO.
Company Overview
With its colorful interface of boards, columns, and automation that replaced the chaos of spreadsheets, monday.com (NASDAQ: MNDY) is a cloud-based work operating system that helps teams manage projects, track tasks, and streamline workflows through customizable interfaces.
Revenue Growth
A company’s long-term sales performance can indicate its overall quality. Any business can put up a good quarter or two, but the best consistently grow over the long haul. Thankfully, monday.com’s 53.3% annualized revenue growth over the last five years was incredible. Its growth surpassed the average software company and shows its offerings resonate with customers, a great starting point for our analysis.
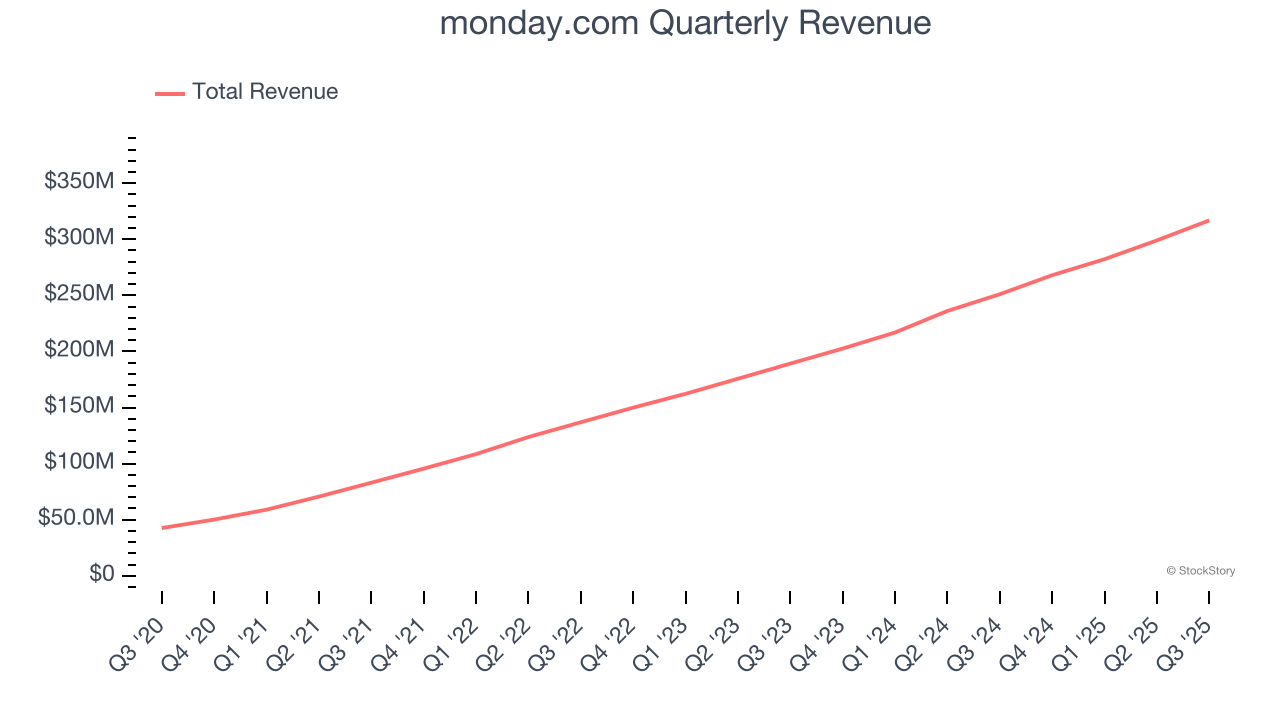
We at StockStory place the most emphasis on long-term growth, but within software, a half-decade historical view may miss recent innovations or disruptive industry trends. monday.com’s annualized revenue growth of 31.2% over the last two years is below its five-year trend, but we still think the results suggest healthy demand. 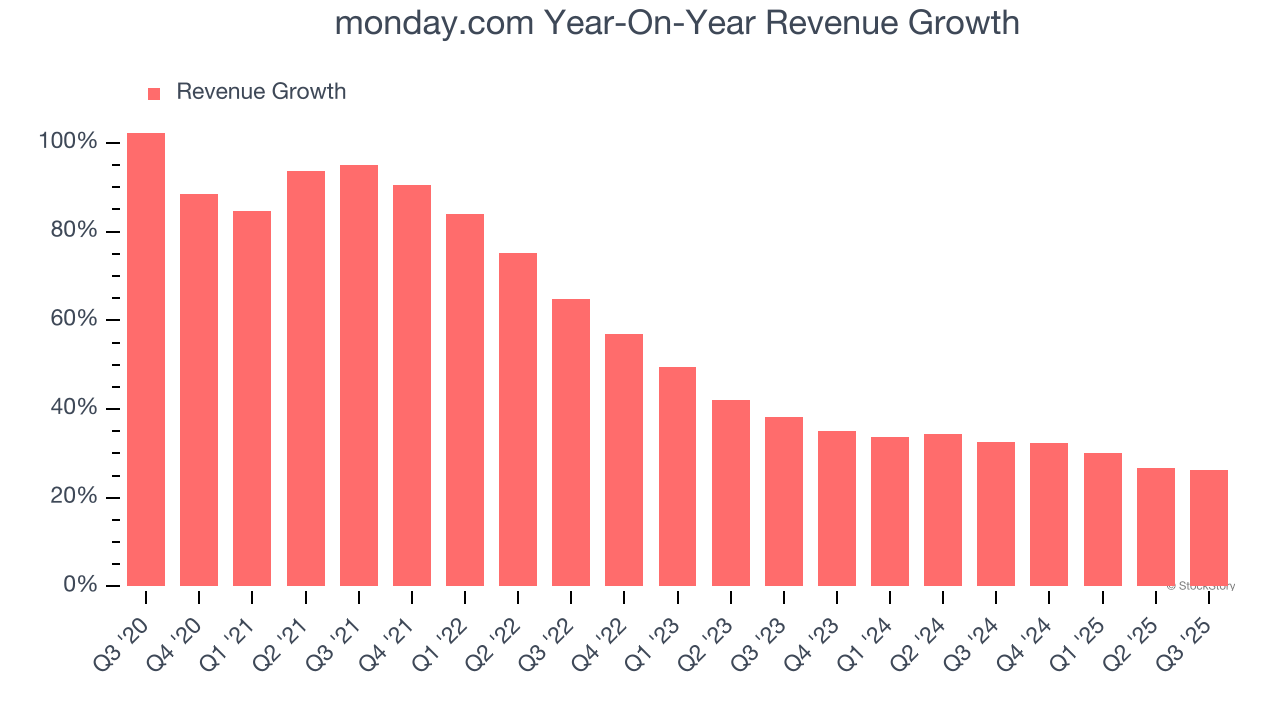
This quarter, monday.com reported robust year-on-year revenue growth of 26.2%, and its $316.9 million of revenue topped Wall Street estimates by 1.4%. Company management is currently guiding for a 22.8% year-on-year increase in sales next quarter.
Looking further ahead, sell-side analysts expect revenue to grow 22.6% over the next 12 months, a deceleration versus the last two years. Still, this projection is admirable and suggests the market sees success for its products and services.
While Wall Street chases Nvidia at all-time highs, an under-the-radar semiconductor supplier is dominating a critical AI component these giants can’t build without. Click here to access our free report one of our favorites growth stories.
Customer Retention
One of the best parts about the software-as-a-service business model (and a reason why they trade at high valuation multiples) is that customers typically spend more on a company’s products and services over time.
monday.com’s net revenue retention rate, a key performance metric measuring how much money existing customers from a year ago are spending today, was 115% in Q3. This means monday.com would’ve grown its revenue by 15% even if it didn’t win any new customers over the last 12 months.
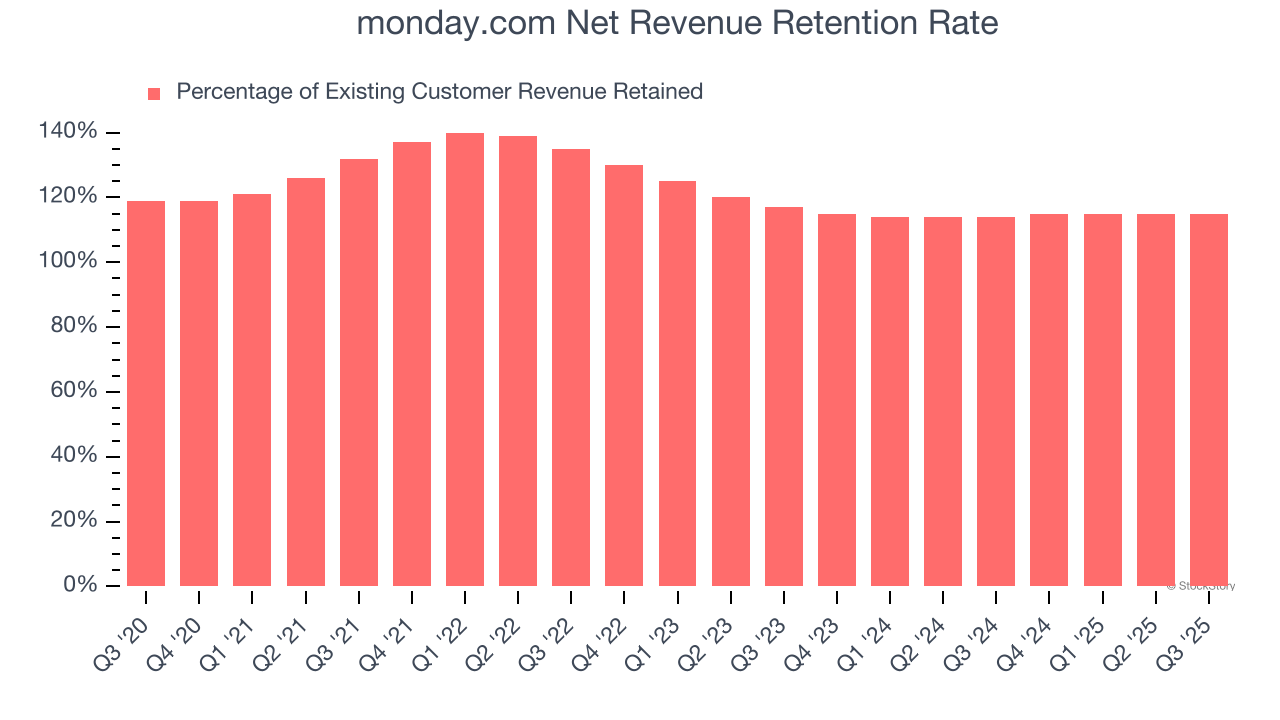
monday.com has a good net retention rate, proving that customers are satisfied with its software and getting more value from it over time, which is always great to see.
Key Takeaways from monday.com’s Q3 Results
It was good to see monday.com narrowly top analysts’ revenue expectations this quarter. On the other hand, its revenue guidance for next quarter slightly missed. The latter is weighing on shares. The stock traded down 17.4% to $156.89 immediately after reporting.
The latest quarter from monday.com’s wasn’t that good. One earnings report doesn’t define a company’s quality, though, so let’s explore whether the stock is a buy at the current price. What happened in the latest quarter matters, but not as much as longer-term business quality and valuation, when deciding whether to invest in this stock. We cover that in our actionable full research report which you can read here, it’s free for active Edge members.