
Over the last six months, Workday’s shares have sunk to $225.38, producing a disappointing 15.5% loss - a stark contrast to the S&P 500’s 15.3% gain. This may have investors wondering how to approach the situation.
Is there a buying opportunity in Workday, or does it present a risk to your portfolio? See what our analysts have to say in our full research report, it’s free for active Edge members.
Why Is Workday Not Exciting?
Even though the stock has become cheaper, we're cautious about Workday. Here are three reasons why WDAY doesn't excite us and a stock we'd rather own.
1. Weak Billings Point to Soft Demand
Billings is a non-GAAP metric that is often called “cash revenue” because it shows how much money the company has collected from customers in a certain period. This is different from revenue, which must be recognized in pieces over the length of a contract.
Workday’s billings came in at $2.39 billion in Q2, and over the last four quarters, its year-on-year growth averaged 13.7%. This performance slightly lagged the sector and suggests that increasing competition is causing challenges in acquiring/retaining customers. 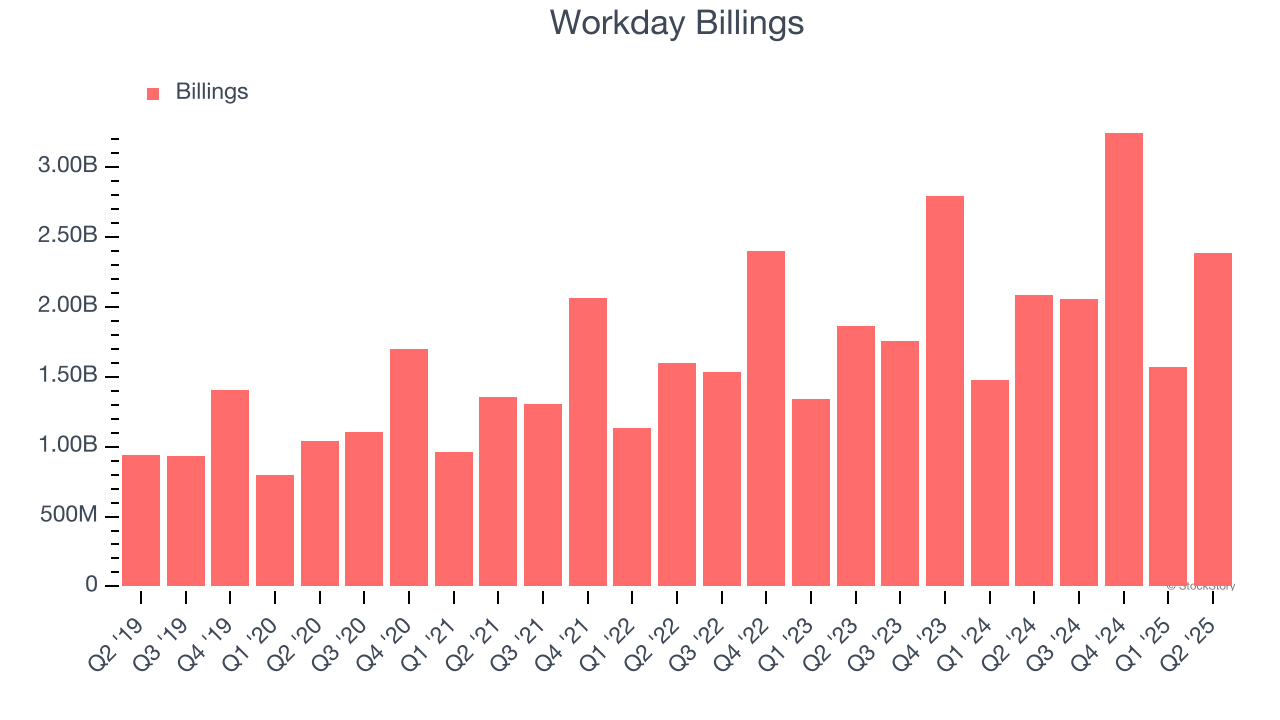
2. Projected Revenue Growth Is Slim
Forecasted revenues by Wall Street analysts signal a company’s potential. Predictions may not always be accurate, but accelerating growth typically boosts valuation multiples and stock prices while slowing growth does the opposite.
Over the next 12 months, sell-side analysts expect Workday’s revenue to rise by 12.8%, a slight deceleration versus its 17.5% annualized growth for the past five years. This projection doesn't excite us and implies its products and services will face some demand challenges.
3. Operating Margin Rising, Profits Up
Many software businesses adjust their profits for stock-based compensation (SBC), but we prioritize GAAP operating margin because SBC is a real expense used to attract and retain engineering and sales talent. This is one of the best measures of profitability because it shows how much money a company takes home after developing, marketing, and selling its products.
Analyzing the trend in its profitability, Workday’s operating margin rose by 1.5 percentage points over the last two years, as its sales growth gave it operating leverage. Its operating margin for the trailing 12 months was 5.9%.

Final Judgment
Workday isn’t a terrible business, but it doesn’t pass our quality test. After the recent drawdown, the stock trades at 6× forward price-to-sales (or $225.38 per share). This valuation is reasonable, but the company’s shakier fundamentals present too much downside risk. We're fairly confident there are better investments elsewhere. We’d suggest looking at one of our all-time favorite software stocks.
High-Quality Stocks for All Market Conditions
Fresh US-China trade tensions just tanked stocks—but strong bank earnings are fueling a sharp rebound. Don’t miss the bounce.
Don’t let fear keep you from great opportunities and take a look at Top 5 Growth Stocks for this month. This is a curated list of our High Quality stocks that have generated a market-beating return of 183% over the last five years (as of March 31st 2025).
Stocks that made our list in 2020 include now familiar names such as Nvidia (+1,545% between March 2020 and March 2025) as well as under-the-radar businesses like the once-micro-cap company Kadant (+351% five-year return). Find your next big winner with StockStory today.
StockStory is growing and hiring equity analyst and marketing roles. Are you a 0 to 1 builder passionate about the markets and AI? See the open roles here.


