
Although Timken (currently trading at $78.90 per share) has gained 8.4% over the last six months, it has trailed the S&P 500’s 16.9% return during that period. This might have investors contemplating their next move.
Is there a buying opportunity in Timken, or does it present a risk to your portfolio? See what our analysts have to say in our full research report, it’s free for active Edge members.
Why Do We Think Timken Will Underperform?
We're swiping left on Timken for now. Here are three reasons why TKR doesn't excite us and a stock we'd rather own.
1. Core Business Falling Behind as Demand Declines
In addition to reported revenue, organic revenue is a useful data point for analyzing Engineered Components and Systems companies. This metric gives visibility into Timken’s core business because it excludes one-time events such as mergers, acquisitions, and divestitures along with foreign currency fluctuations - non-fundamental factors that can manipulate the income statement.
Over the last two years, Timken’s organic revenue averaged 4.1% year-on-year declines. This performance was underwhelming and implies it may need to improve its products, pricing, or go-to-market strategy. It also suggests Timken might have to lean into acquisitions to grow, which isn’t ideal because M&A can be expensive and risky (integrations often disrupt focus). 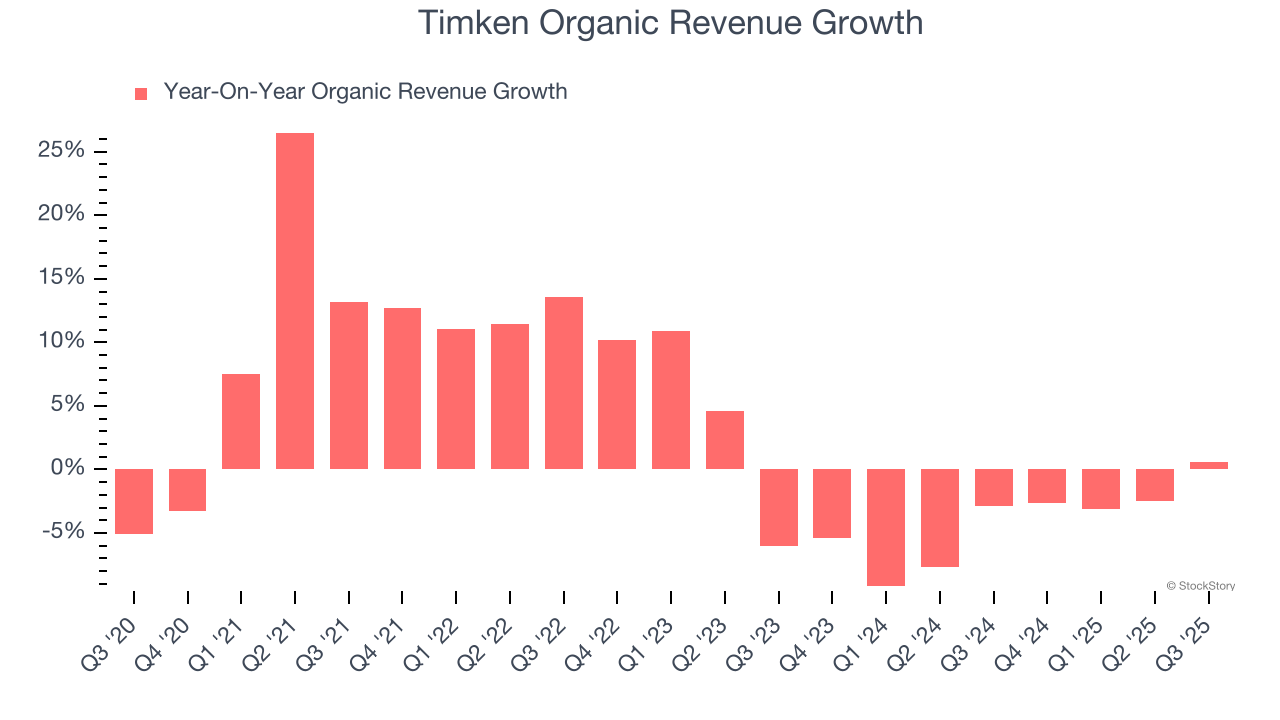
2. Projected Revenue Growth Is Slim
Forecasted revenues by Wall Street analysts signal a company’s potential. Predictions may not always be accurate, but accelerating growth typically boosts valuation multiples and stock prices while slowing growth does the opposite.
Over the next 12 months, sell-side analysts expect Timken’s revenue to rise by 1.7%. Although this projection suggests its newer products and services will spur better top-line performance, it is still below the sector average.
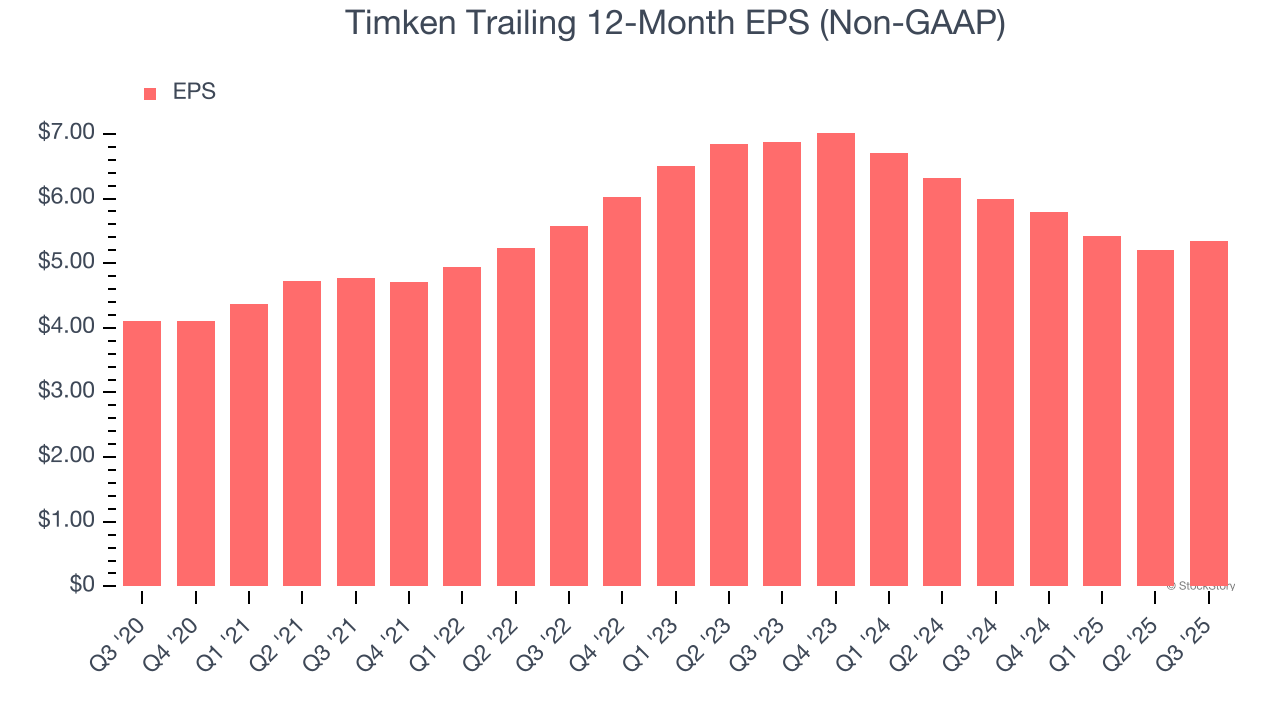
3. EPS Barely Growing
Analyzing the long-term change in earnings per share (EPS) shows whether a company's incremental sales were profitable – for example, revenue could be inflated through excessive spending on advertising and promotions.
Timken’s unimpressive 5.5% annual EPS growth over the last five years aligns with its revenue performance. This tells us it maintained its per-share profitability as it expanded.
Final Judgment
We see the value of companies helping their customers, but in the case of Timken, we’re out. With its shares underperforming the market lately, the stock trades at 13.7× forward P/E (or $78.90 per share). This valuation multiple is fair, but we don’t have much confidence in the company. There are better stocks to buy right now. We’d recommend looking at a dominant Aerospace business that has perfected its M&A strategy.
High-Quality Stocks for All Market Conditions
Trump’s April 2025 tariff bombshell triggered a massive market selloff, but stocks have since staged an impressive recovery, leaving those who panic sold on the sidelines.
Take advantage of the rebound by checking out our Top 5 Strong Momentum Stocks for this week. This is a curated list of our High Quality stocks that have generated a market-beating return of 183% over the last five years (as of March 31st 2025).
Stocks that made our list in 2020 include now familiar names such as Nvidia (+1,545% between March 2020 and March 2025) as well as under-the-radar businesses like the once-small-cap company Comfort Systems (+782% five-year return). Find your next big winner with StockStory today.
StockStory is growing and hiring equity analyst and marketing roles. Are you a 0 to 1 builder passionate about the markets and AI? See the open roles here.


