
Lovesac has gotten torched over the last six months - since May 2025, its stock price has dropped 36.7% to $13.51 per share. This might have investors contemplating their next move.
Is now the time to buy Lovesac, or should you be careful about including it in your portfolio? Check out our in-depth research report to see what our analysts have to say, it’s free for active Edge members.
Why Is Lovesac Not Exciting?
Even with the cheaper entry price, we're cautious about Lovesac. Here are three reasons we avoid LOVE and a stock we'd rather own.
1. Lackluster Revenue Growth
Long-term growth is the most important, but within consumer discretionary, product cycles are short and revenue can be hit-driven due to rapidly changing trends and consumer preferences. Lovesac’s recent performance shows its demand has slowed significantly as its annualized revenue growth of 1.6% over the last two years was well below its five-year trend. 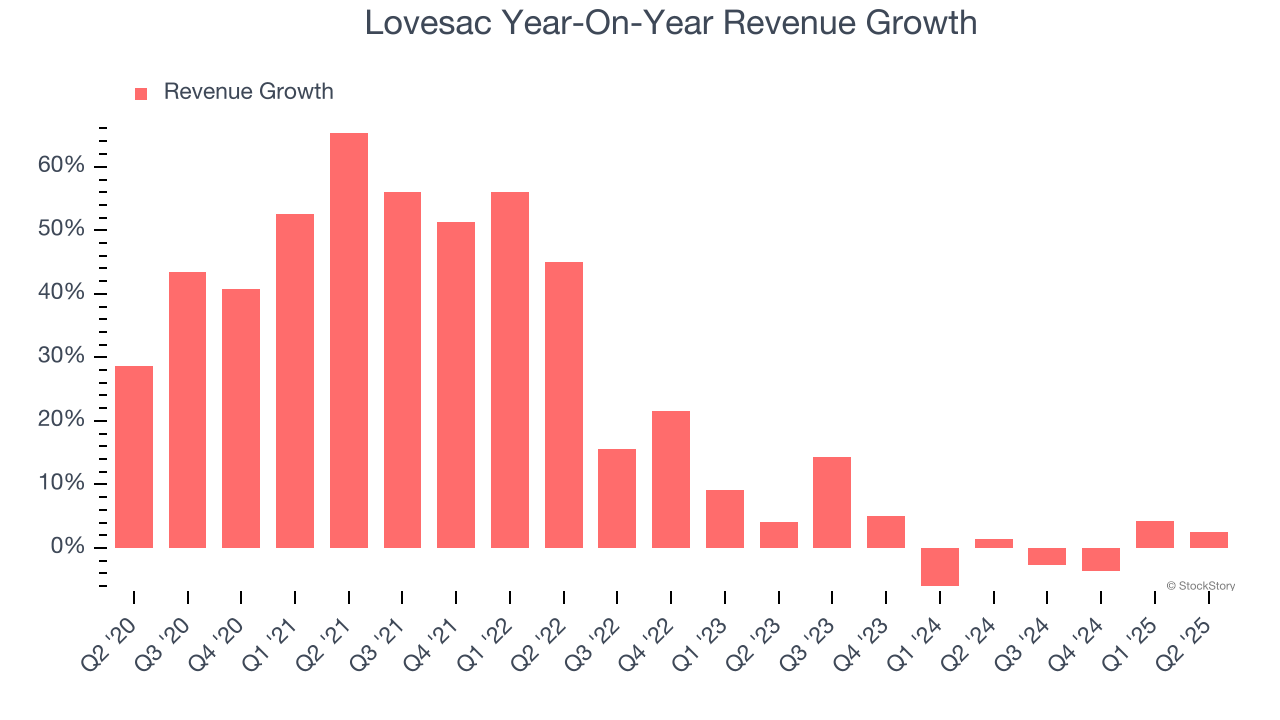
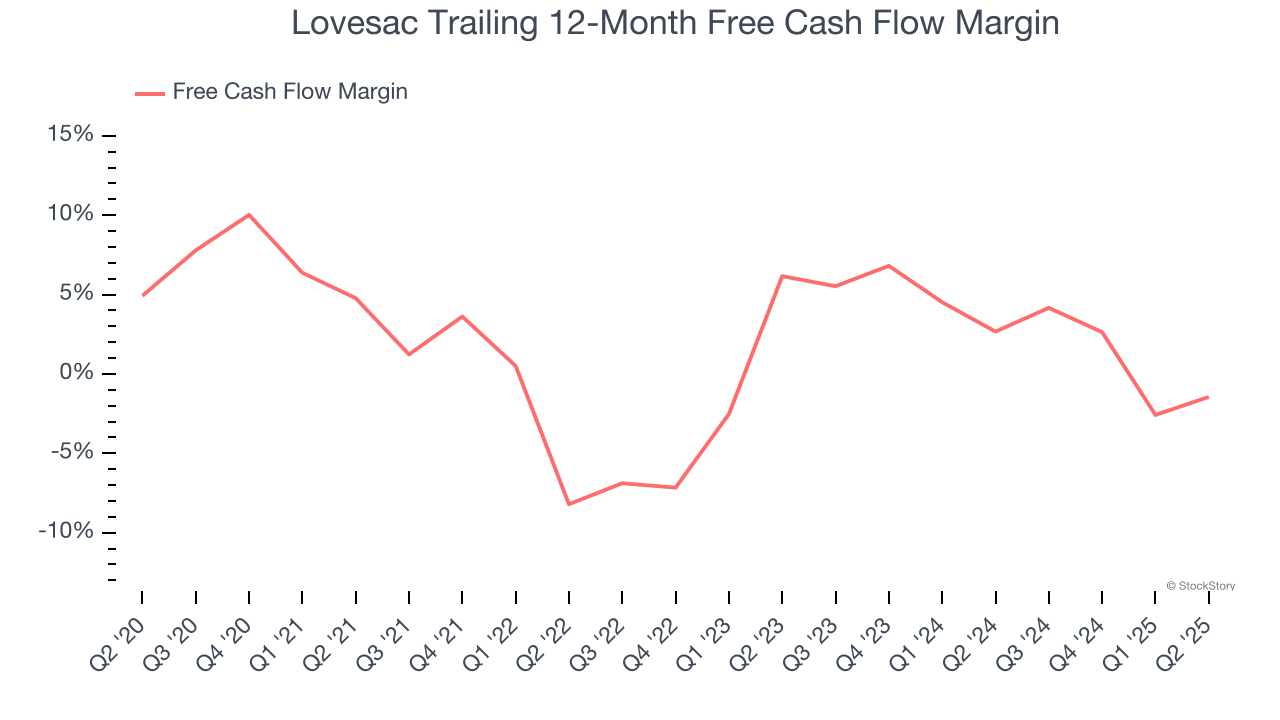
2. Breakeven Free Cash Flow Limits Reinvestment Potential
Free cash flow isn't a prominently featured metric in company financials and earnings releases, but we think it's telling because it accounts for all operating and capital expenses, making it tough to manipulate. Cash is king.
Lovesac broke even from a free cash flow perspective over the last two years, giving the company limited opportunities to return capital to shareholders.
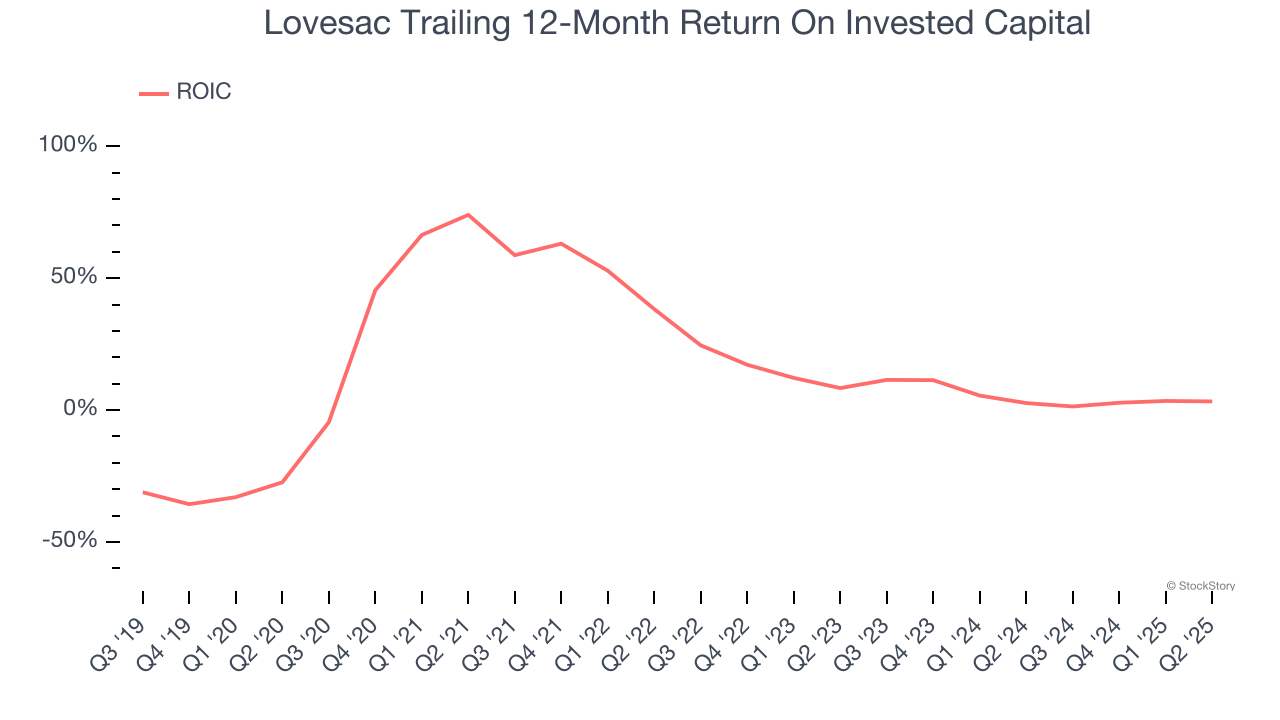
3. New Investments Fail to Bear Fruit as ROIC Declines
ROIC, or return on invested capital, is a metric showing how much operating profit a company generates relative to the money it has raised (debt and equity).
We like to invest in businesses with high returns, but the trend in a company’s ROIC is what often surprises the market and moves the stock price. Unfortunately, Lovesac’s ROIC has decreased significantly over the last few years. We like what management has done in the past, but its declining returns are perhaps a symptom of fewer profitable growth opportunities.
Final Judgment
Lovesac isn’t a terrible business, but it doesn’t pass our bar. After the recent drawdown, the stock trades at 51.5× forward P/E (or $13.51 per share). This valuation is reasonable, but the company’s shakier fundamentals present too much downside risk. We're fairly confident there are better investments elsewhere. Let us point you toward one of our top software and edge computing picks.
High-Quality Stocks for All Market Conditions
The market’s up big this year - but there’s a catch. Just 4 stocks account for half the S&P 500’s entire gain. That kind of concentration makes investors nervous, and for good reason. While everyone piles into the same crowded names, smart investors are hunting quality where no one’s looking - and paying a fraction of the price. Check out the high-quality names we’ve flagged in our Top 9 Market-Beating Stocks. This is a curated list of our High Quality stocks that have generated a market-beating return of 244% over the last five years (as of June 30, 2025).
Stocks that made our list in 2020 include now familiar names such as Nvidia (+1,545% between March 2020 and March 2025) as well as under-the-radar businesses like the once-small-cap company Comfort Systems (+782% five-year return). Find your next big winner with StockStory today.
StockStory is growing and hiring equity analyst and marketing roles. Are you a 0 to 1 builder passionate about the markets and AI? See the open roles here.


