
Earnings results often indicate what direction a company will take in the months ahead. With Q3 behind us, let’s have a look at Mayville Engineering (NYSE: MEC) and its peers.
Engineered components and systems companies possess technical know-how in sometimes narrow areas such as metal forming or intelligent robotics. Lately, automation and connected equipment collecting analyzable data have been trending, creating new demand. On the other hand, like the broader industrials sector, engineered components and systems companies are at the whim of economic cycles. Consumer spending and interest rates, for example, can greatly impact the industrial production that drives demand for these companies’ offerings.
The 12 engineered components and systems stocks we track reported a mixed Q3. As a group, revenues beat analysts’ consensus estimates by 1.5% while next quarter’s revenue guidance was 0.5% below.
Amidst this news, share prices of the companies have had a rough stretch. On average, they are down 5.1% since the latest earnings results.
Mayville Engineering (NYSE: MEC)
Originally founded solely on tool and die manufacturing, Mayville Engineering Company (NYSE: MEC) specializes in metal fabrication, tube bending, and welding to be used in various industries.
Mayville Engineering reported revenues of $144.3 million, up 6.6% year on year. This print exceeded analysts’ expectations by 2.8%. Overall, it was an exceptional quarter for the company with a beat of analysts’ EPS and adjusted operating income estimates.
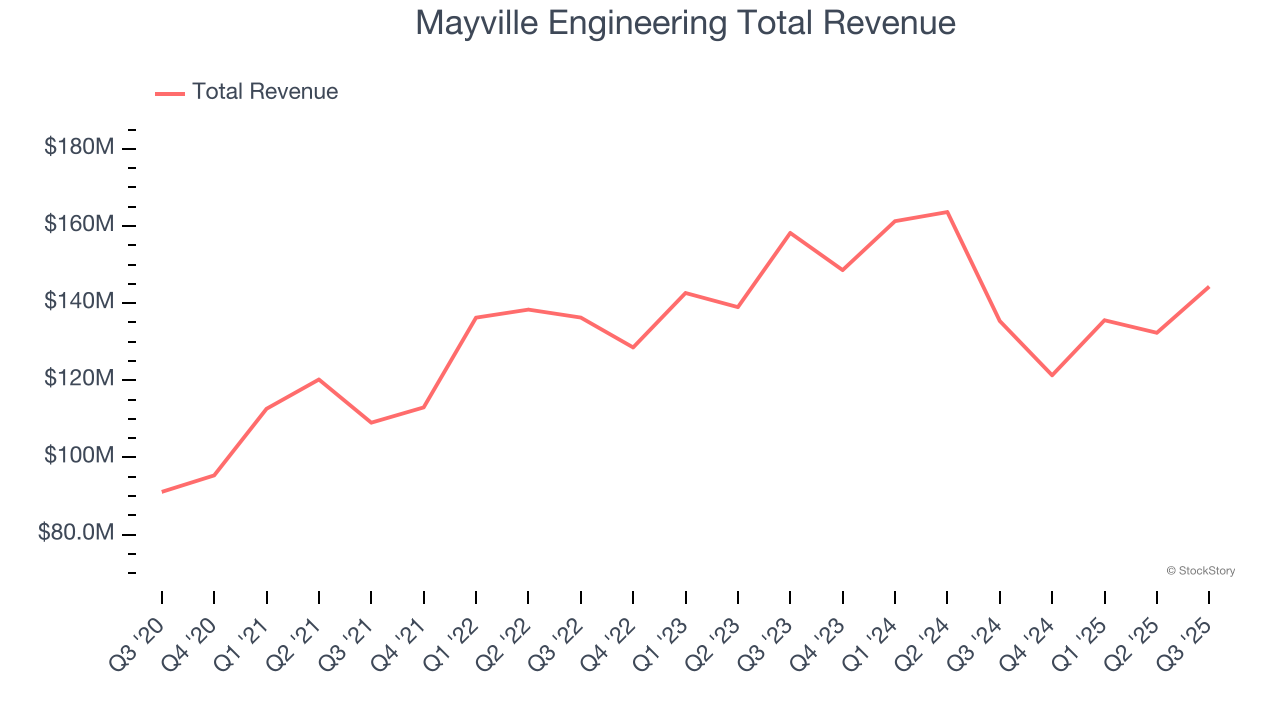
Unsurprisingly, the stock is down 8.1% since reporting and currently trades at $16.58.
Is now the time to buy Mayville Engineering? Access our full analysis of the earnings results here, it’s free for active Edge members.
Best Q3: Timken (NYSE: TKR)
Established after the founder noticed the difficulty freight wagons had making sharp turns, Timken (NYSE: TKR) is a provider of industrial parts used across various sectors.
Timken reported revenues of $1.16 billion, up 2.7% year on year, outperforming analysts’ expectations by 3.6%. The business had an exceptional quarter with an impressive beat of analysts’ adjusted operating income estimates and a solid beat of analysts’ revenue estimates.
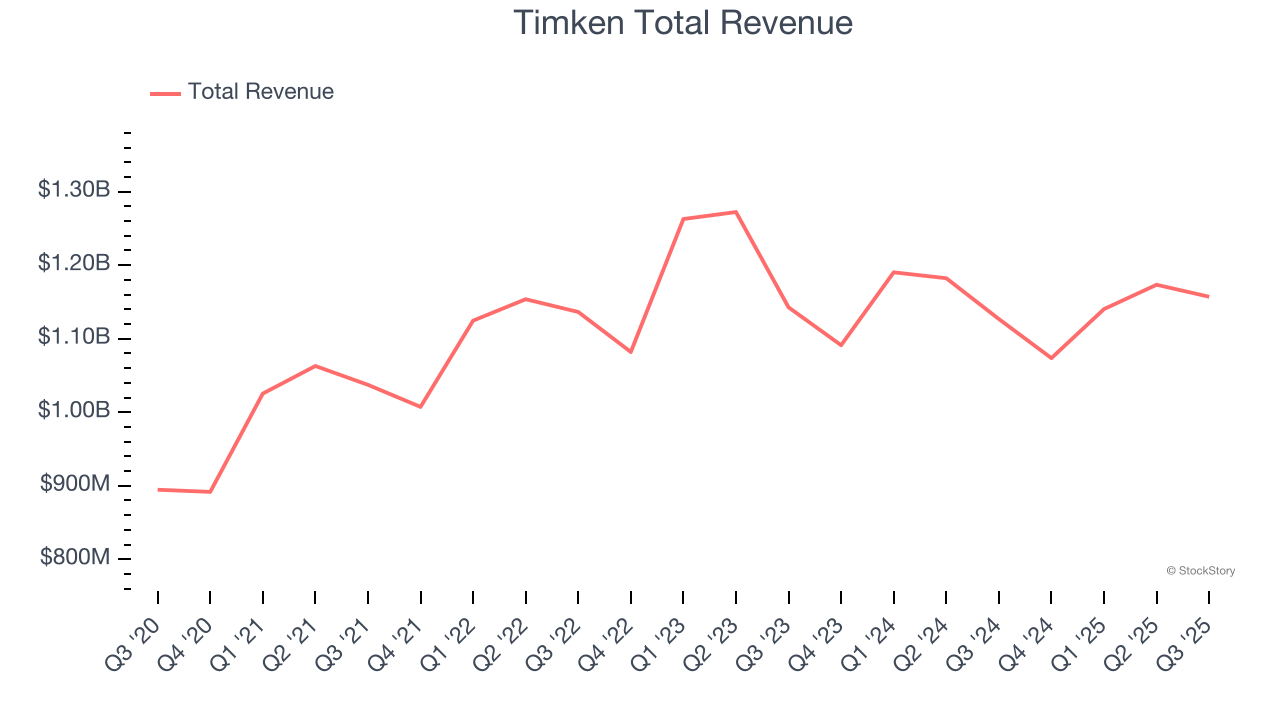
The market seems content with the results as the stock is up 2.5% since reporting. It currently trades at $79.12.
Is now the time to buy Timken? Access our full analysis of the earnings results here, it’s free for active Edge members.
Weakest Q3: Park-Ohio (NASDAQ: PKOH)
Based in Cleveland, Park-Ohio (NASDAQ: PKOH) provides supply chain management services, capital equipment, and manufactured components.
Park-Ohio reported revenues of $398.6 million, down 4.5% year on year, falling short of analysts’ expectations by 4.5%. It was a disappointing quarter as it posted full-year EPS guidance missing analysts’ expectations.
As expected, the stock is down 5.2% since the results and currently trades at $20.00.
Read our full analysis of Park-Ohio’s results here.
Worthington (NYSE: WOR)
Founded by a steel salesman, Worthington (NYSE: WOR) specializes in steel processing, pressure cylinders, and engineered cabs for commercial markets.
Worthington reported revenues of $303.7 million, up 18% year on year. This number surpassed analysts’ expectations by 1.4%. Zooming out, it was a satisfactory quarter as it also logged an impressive beat of analysts’ adjusted operating income estimates but a significant miss of analysts’ EBITDA estimates.
The stock is down 8.4% since reporting and currently trades at $55.19.
Read our full, actionable report on Worthington here, it’s free for active Edge members.
Graham Corporation (NYSE: GHM)
Founded when its founder patented a unique design for a vacuum system used in the sugar refining process, Graham (NYSE: GHM) provides vacuum and heat transfer equipment for the energy, petrochemical, refining, and chemical sectors.
Graham Corporation reported revenues of $66.03 million, up 23.3% year on year. This print topped analysts’ expectations by 14.7%. Overall, it was a strong quarter as it also logged a solid beat of analysts’ revenue estimates and an impressive beat of analysts’ EBITDA estimates.
Graham Corporation achieved the biggest analyst estimates beat and fastest revenue growth, but had the weakest full-year guidance update among its peers. The stock is down 2.1% since reporting and currently trades at $60.99.
Read our full, actionable report on Graham Corporation here, it’s free for active Edge members.
Market Update
Thanks to the Fed’s rate hikes in 2022 and 2023, inflation has been on a steady path downward, easing back toward that 2% sweet spot. Fortunately (miraculously to some), all this tightening didn’t send the economy tumbling into a recession, so here we are, cautiously celebrating a soft landing. The cherry on top? Recent rate cuts (half a point in September 2024, a quarter in November) have propped up markets, especially after Trump’s November win lit a fire under major indices and sent them to all-time highs. However, there’s still plenty to ponder — tariffs, corporate tax cuts, and what 2025 might hold for the economy.
Want to invest in winners with rock-solid fundamentals? Check out our Top 6 Stocks and add them to your watchlist. These companies are poised for growth regardless of the political or macroeconomic climate.
StockStory is growing and hiring equity analyst and marketing roles. Are you a 0 to 1 builder passionate about the markets and AI? See the open roles here.


