What a time it’s been for Monro. In the past six months alone, the company’s stock price has increased by a massive 42.1%, reaching $18.16 per share. This was partly due to its solid quarterly results, and the run-up might have investors contemplating their next move.
Is now the time to buy Monro, or should you be careful about including it in your portfolio? Dive into our full research report to see our analyst team’s opinion, it’s free for active Edge members.
Why Do We Think Monro Will Underperform?
We’re happy investors have made money, but we don't have much confidence in Monro. Here are three reasons there are better opportunities than MNRO and a stock we'd rather own.
1. Stores Are Closing, a Headwind for Revenue
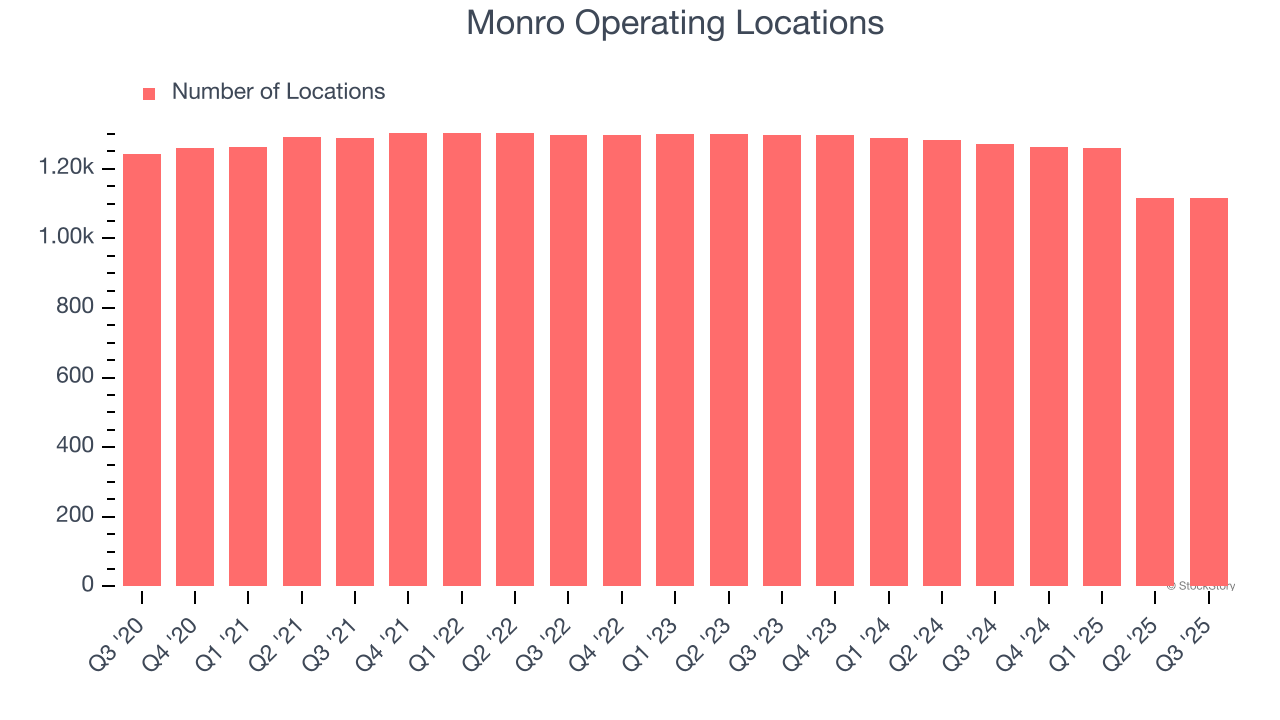
The number of stores a retailer operates is a critical driver of how quickly company-level sales can grow.
Monro operated 1,116 locations in the latest quarter. Over the last two years, the company has generally closed its stores, averaging 4.3% annual declines.
When a retailer shutters stores, it usually means that brick-and-mortar demand is less than supply, and it is responding by closing underperforming locations to improve profitability.
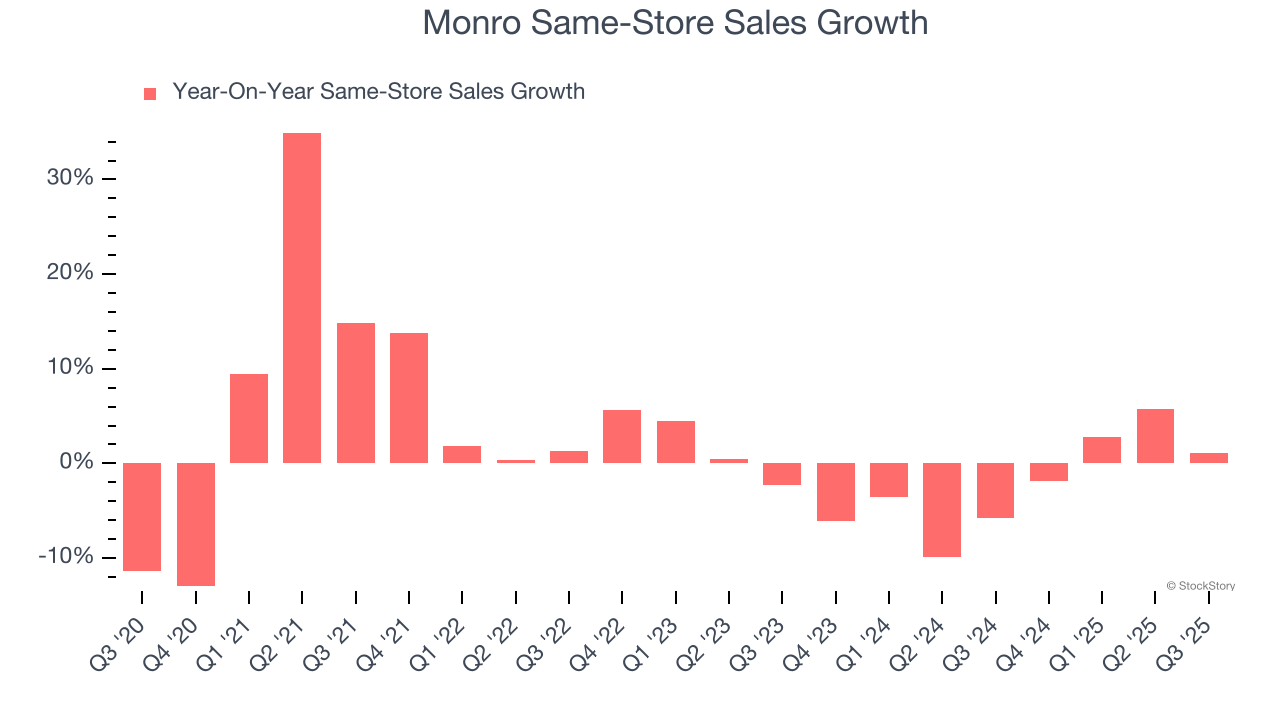
2. Shrinking Same-Store Sales Indicate Waning Demand
Same-store sales show the change in sales for a retailer's e-commerce platform and brick-and-mortar shops that have existed for at least a year. This is a key performance indicator because it measures organic growth.
Monro’s demand has been shrinking over the last two years as its same-store sales have averaged 2.2% annual declines.
3. Previous Growth Initiatives Haven’t Impressed
Growth gives us insight into a company’s long-term potential, but how capital-efficient was that growth? Enter ROIC, a metric showing how much operating profit a company generates relative to the money it has raised (debt and equity).
Monro historically did a mediocre job investing in profitable growth initiatives. Its five-year average ROIC was 4.8%, lower than the typical cost of capital (how much it costs to raise money) for consumer retail companies.
Final Judgment
We see the value of companies helping consumers, but in the case of Monro, we’re out. After the recent surge, the stock trades at 32.6× forward P/E (or $18.16 per share). This multiple tells us a lot of good news is priced in - you can find more timely opportunities elsewhere. We’d suggest looking at one of Charlie Munger’s all-time favorite businesses.
Stocks We Like More Than Monro
The market’s up big this year - but there’s a catch. Just 4 stocks account for half the S&P 500’s entire gain. That kind of concentration makes investors nervous, and for good reason. While everyone piles into the same crowded names, smart investors are hunting quality where no one’s looking - and paying a fraction of the price. Check out the high-quality names we’ve flagged in our Top 5 Growth Stocks for this month. This is a curated list of our High Quality stocks that have generated a market-beating return of 244% over the last five years (as of June 30, 2025).
Stocks that made our list in 2020 include now familiar names such as Nvidia (+1,545% between March 2020 and March 2025) as well as under-the-radar businesses like the once-small-cap company Exlservice (+354% five-year return). Find your next big winner with StockStory today.
StockStory is growing and hiring equity analyst and marketing roles. Are you a 0 to 1 builder passionate about the markets and AI? See the open roles here.