
Royalty Pharma trades at $39.59 and has moved in lockstep with the market. Its shares have returned 20.6% over the last six months while the S&P 500 has gained 16.4%.
Is now the time to buy Royalty Pharma, or should you be careful about including it in your portfolio? See what our analysts have to say in our full research report, it’s free for active Edge members.
Why Is Royalty Pharma Not Exciting?
We're swiping left on Royalty Pharma for now. Here are three reasons why RPRX doesn't excite us and a stock we'd rather own.
1. Long-Term Revenue Growth Disappoints
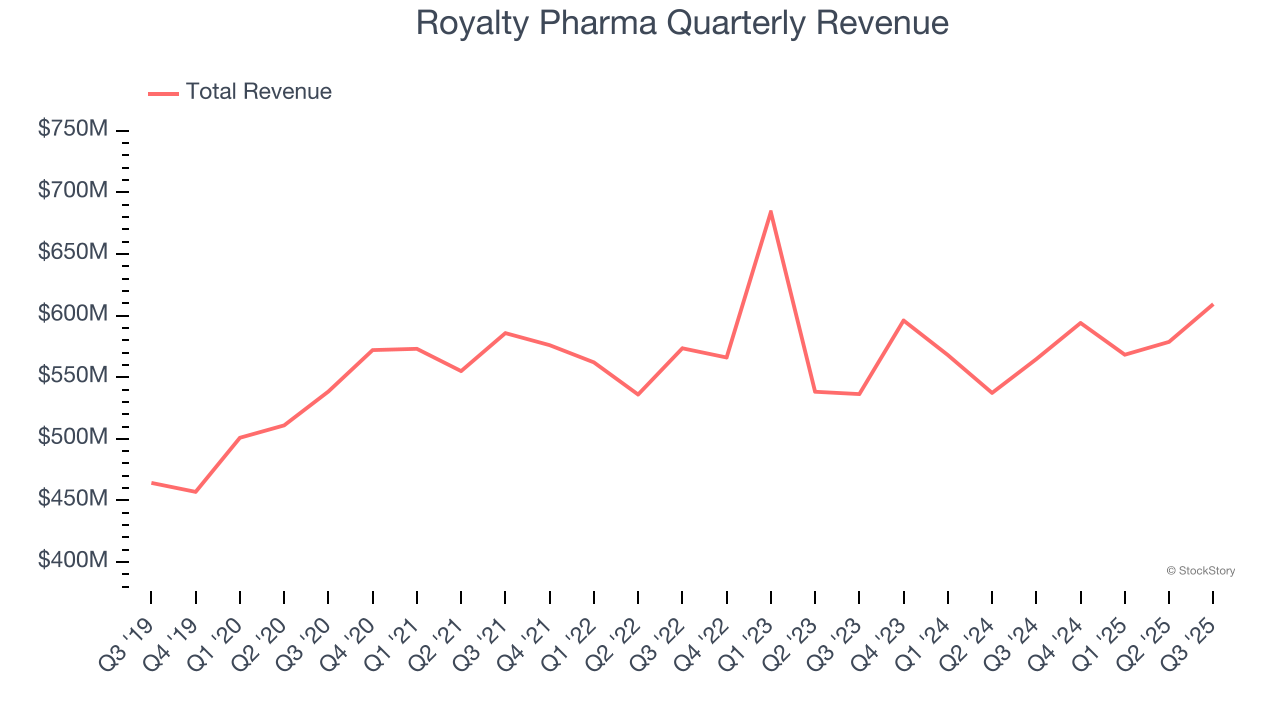
Examining a company’s long-term performance can provide clues about its quality. Any business can put up a good quarter or two, but many enduring ones grow for years. Over the last five years, Royalty Pharma grew its sales at a tepid 3.2% compounded annual growth rate. This fell short of our benchmark for the healthcare sector.
2. Fewer Distribution Channels than Larger Competitors
Larger companies benefit from economies of scale, where fixed costs like infrastructure, technology, and administration are spread over a higher volume of goods or services, reducing the cost per unit. Scale can also lead to bargaining power with suppliers, greater brand recognition, and more investment firepower. A virtuous cycle can ensue if a scaled company plays its cards right.
With just $2.35 billion in revenue over the past 12 months, Royalty Pharma lacks scale in an industry where it matters. This makes it difficult to build trust with customers because healthcare is heavily regulated, complex, and resource-intensive.
3. Shrinking Adjusted Operating Margin
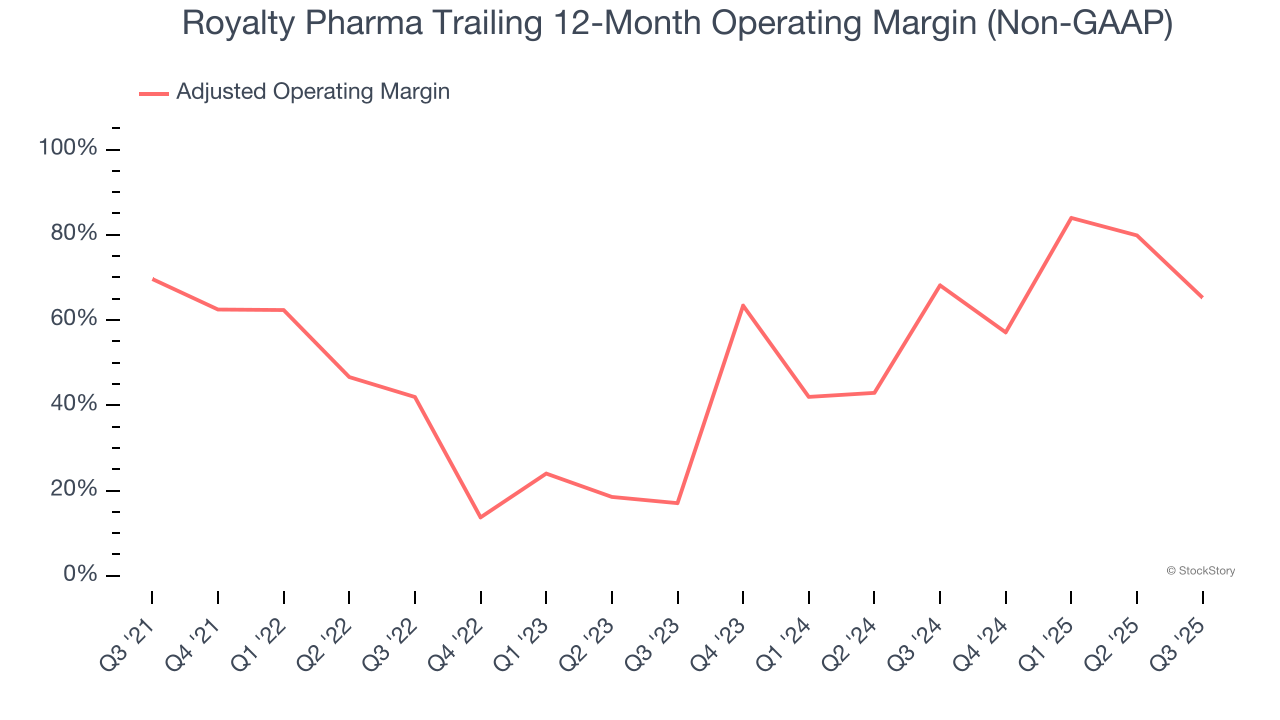
Adjusted operating margin is a key measure of profitability. Think of it as net income (the bottom line) excluding the impact of non-recurring expenses, taxes, and interest on debt - metrics less connected to business fundamentals.
Looking at the trend in its profitability, Royalty Pharma’s adjusted operating margin decreased by 4.4 percentage points over the last five years. This raises questions about the company’s expense base because its revenue growth should have given it leverage on its fixed costs, resulting in better economies of scale and profitability. Its adjusted operating margin for the trailing 12 months was 65.2%.
Final Judgment
Royalty Pharma isn’t a terrible business, but it isn’t one of our picks. That said, the stock currently trades at 7.8× forward P/E (or $39.59 per share). While this valuation is fair, the upside isn’t great compared to the potential downside. We're pretty confident there are superior stocks to buy right now. Let us point you toward a safe-and-steady industrials business benefiting from an upgrade cycle.
High-Quality Stocks for All Market Conditions
If your portfolio success hinges on just 4 stocks, your wealth is built on fragile ground. You have a small window to secure high-quality assets before the market widens and these prices disappear.
Don’t wait for the next volatility shock. Check out our Top 5 Strong Momentum Stocks for this week. This is a curated list of our High Quality stocks that have generated a market-beating return of 244% over the last five years (as of June 30, 2025).
Stocks that made our list in 2020 include now familiar names such as Nvidia (+1,545% between March 2020 and March 2025) as well as under-the-radar businesses like the once-small-cap company Comfort Systems (+782% five-year return). Find your next big winner with StockStory today.
StockStory is growing and hiring equity analyst and marketing roles. Are you a 0 to 1 builder passionate about the markets and AI? See the open roles here.


