Beauty supply retailer Sally Beauty (NYSE: SBH) reported Q3 CY2025 results exceeding the market’s revenue expectations, with sales up 1.3% year on year to $947.1 million. The company expects the full year’s revenue to be around $3.74 billion, close to analysts’ estimates. Its non-GAAP profit of $0.55 per share was 16% above analysts’ consensus estimates.
Is now the time to buy Sally Beauty? Find out by accessing our full research report, it’s free for active Edge members.
Sally Beauty (SBH) Q3 CY2025 Highlights:
- Revenue: $947.1 million vs analyst estimates of $931.8 million (1.3% year-on-year growth, 1.6% beat)
- Adjusted EPS: $0.55 vs analyst estimates of $0.47 (16% beat)
- Adjusted EBITDA: $117.4 million vs analyst estimates of $110.1 million (12.4% margin, 6.6% beat)
- Adjusted EPS guidance for the upcoming financial year 2026 is $2.05 at the midpoint, beating analyst estimates by 1.8%
- Operating Margin: 8.4%, in line with the same quarter last year
- Free Cash Flow Margin: 8.2%, similar to the same quarter last year
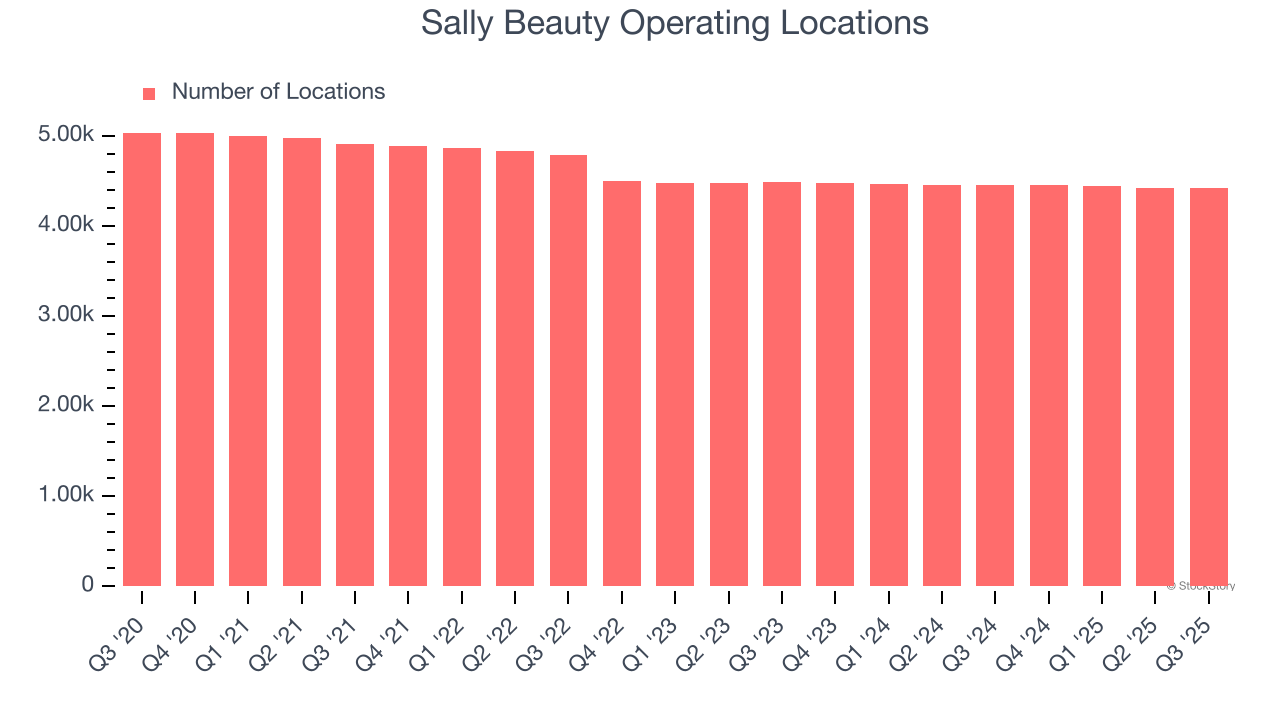
- Locations: 4,422 at quarter end, down from 4,460 in the same quarter last year
- Same-Store Sales rose 1.3% year on year, in line with the same quarter last year
- Market Capitalization: $1.45 billion
Company Overview
Catering to both everyday consumers as well as salon professionals, Sally Beauty (NYSE: SBH) is a retailer that sells salon-quality beauty products such as makeup and haircare products.
Revenue Growth
A company’s long-term sales performance can indicate its overall quality. Any business can experience short-term success, but top-performing ones enjoy sustained growth for years.
With $3.70 billion in revenue over the past 12 months, Sally Beauty is a small retailer, which sometimes brings disadvantages compared to larger competitors benefiting from economies of scale and negotiating leverage with suppliers.
As you can see below, Sally Beauty struggled to increase demand as its $3.70 billion of sales for the trailing 12 months was close to its revenue six years ago (we compare to 2019 to normalize for COVID-19 impacts). This was mainly because it didn’t open many new stores.
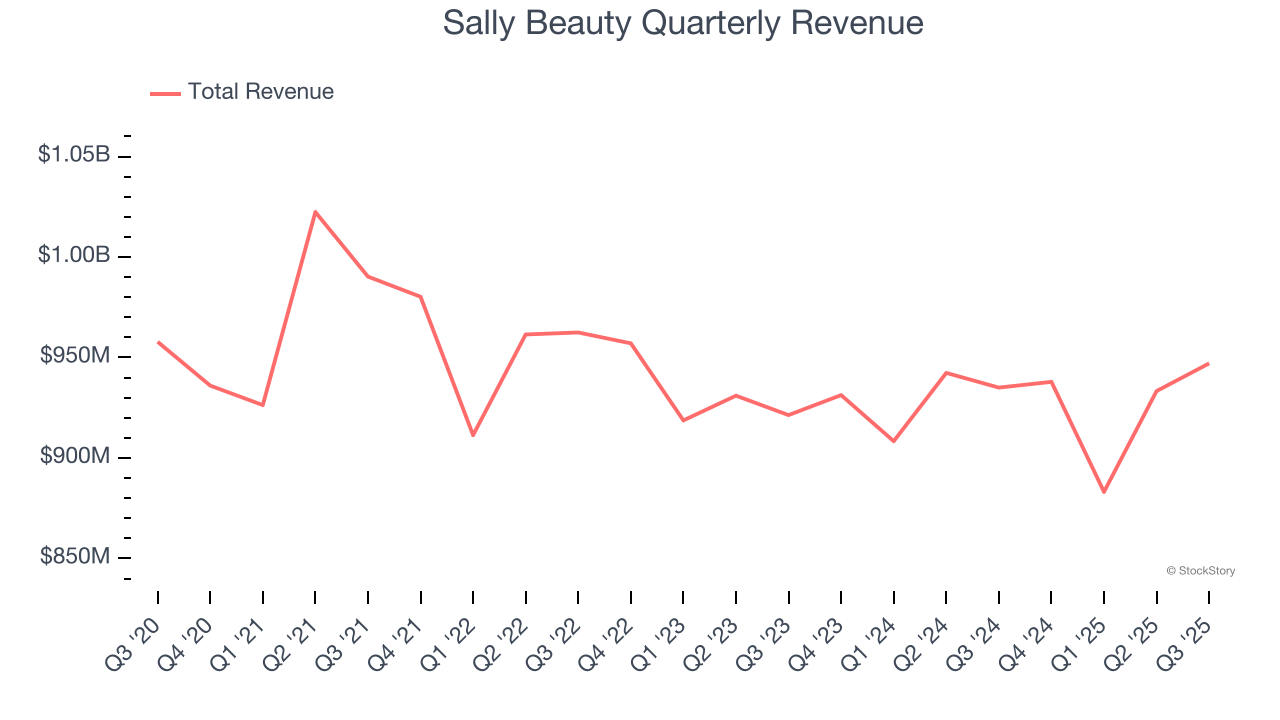
This quarter, Sally Beauty reported modest year-on-year revenue growth of 1.3% but beat Wall Street’s estimates by 1.6%.
Looking ahead, sell-side analysts expect revenue to remain flat over the next 12 months. Although this projection implies its newer products will catalyze better top-line performance, it is still below average for the sector.
Microsoft, Alphabet, Coca-Cola, Monster Beverage—all began as under-the-radar growth stories riding a massive trend. We’ve identified the next one: a profitable AI semiconductor play Wall Street is still overlooking. Go here for access to our full report.
Store Performance
Number of Stores
Sally Beauty listed 4,422 locations in the latest quarter and has kept its store count flat over the last two years while other consumer retail businesses have opted for growth.
When a retailer keeps its store footprint steady, it usually means demand is stable and it’s focusing on operational efficiency to increase profitability.
Same-Store Sales
A company's store base only paints one part of the picture. When demand is high, it makes sense to open more. But when demand is low, it’s prudent to close some locations and use the money in other ways. Same-store sales is an industry measure of whether revenue is growing at those existing stores and is driven by customer visits (often called traffic) and the average spending per customer (ticket).
Sally Beauty’s demand within its existing locations has barely increased over the last two years as its same-store sales were flat. This performance isn’t ideal, and we’d be skeptical if Sally Beauty starts opening new stores to artificially boost revenue growth.
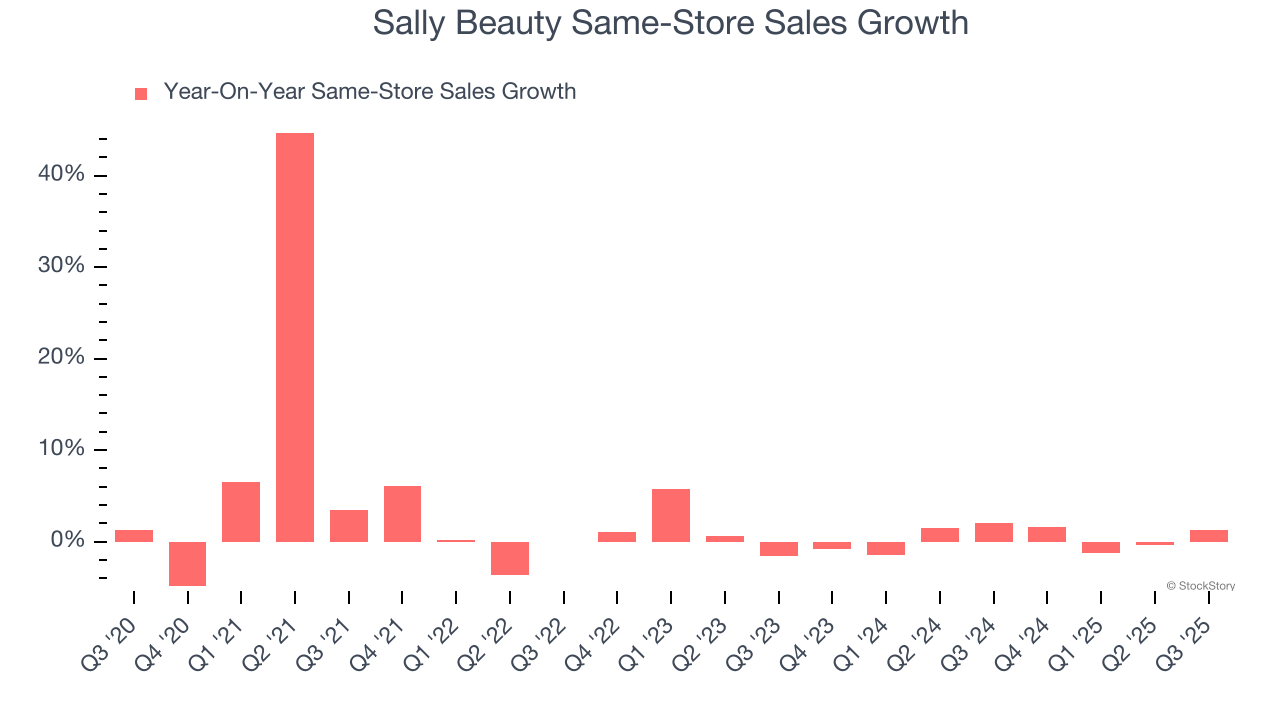
In the latest quarter, Sally Beauty’s same-store sales rose 1.3% year on year. This performance was more or less in line with its historical levels.
Key Takeaways from Sally Beauty’s Q3 Results
We enjoyed seeing Sally Beauty beat analysts’ EBITDA expectations this quarter. We were also glad its EPS outperformed Wall Street’s estimates. Overall, we think this was a solid quarter with some key areas of upside. The stock traded up 1.7% to $14.94 immediately following the results.
Indeed, Sally Beauty had a rock-solid quarterly earnings result, but is this stock a good investment here? When making that decision, it’s important to consider its valuation, business qualities, as well as what has happened in the latest quarter. We cover that in our actionable full research report which you can read here, it’s free for active Edge members.


