Nutrition products company Bellring Brands (NYSE: BRBR) reported revenue ahead of Wall Streets expectations in Q3 CY2025, with sales up 16.6% year on year to $648.2 million. On the other hand, the company’s full-year revenue guidance of $2.45 billion at the midpoint came in 2.1% below analysts’ estimates. Its non-GAAP profit of $0.51 per share was 6.8% below analysts’ consensus estimates.
Is now the time to buy BellRing Brands? Find out by accessing our full research report, it’s free for active Edge members.
BellRing Brands (BRBR) Q3 CY2025 Highlights:
- Revenue: $648.2 million vs analyst estimates of $633.6 million (16.6% year-on-year growth, 2.3% beat)
- Adjusted EPS: $0.51 vs analyst expectations of $0.55 (6.8% miss)
- Adjusted EBITDA: $117.4 million vs analyst estimates of $120.9 million (18.1% margin, 2.9% miss)
- EBITDA guidance for the upcoming financial year 2026 is $440 million at the midpoint, below analyst estimates of $489.1 million
- Operating Margin: 15.8%, down from 20.2% in the same quarter last year
- Organic Revenue rose 16.6% year on year vs analyst estimates of 14.4% growth (215.5 basis point beat)
- Sales Volumes rose 19.2% year on year, in line with the same quarter last year
- Market Capitalization: $3.23 billion
“We delivered strong results in 2025, with sales up 16% driven by expanding household penetration, continued distribution gains and meaningful innovation performance,” said Darcy Davenport, President and Chief Executive Officer of BellRing.
Company Overview
Spun out of Post Holdings in 2019, Bellring Brands (NYSE: BRBR) offers protein shakes, nutrition bars, and other products under the PowerBar, Premier Protein, and Dymatize brands.
Revenue Growth
A company’s long-term sales performance is one signal of its overall quality. Any business can have short-term success, but a top-tier one grows for years.
With $2.32 billion in revenue over the past 12 months, BellRing Brands is a small consumer staples company, which sometimes brings disadvantages compared to larger competitors benefiting from economies of scale and negotiating leverage with retailers. On the bright side, it can grow faster because it has a longer list of untapped store chains to sell into.
As you can see below, BellRing Brands’s sales grew at an impressive 19.1% compounded annual growth rate over the last three years as consumers bought more of its products.
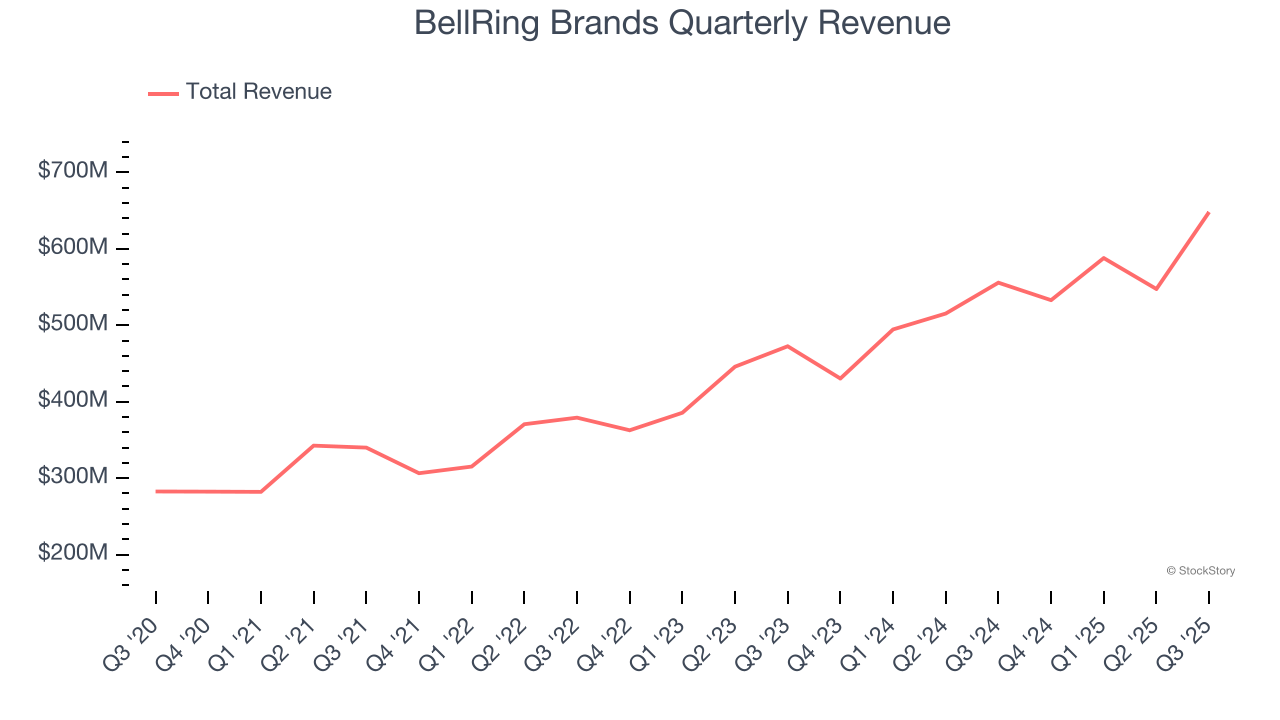
This quarter, BellRing Brands reported year-on-year revenue growth of 16.6%, and its $648.2 million of revenue exceeded Wall Street’s estimates by 2.3%.
Looking ahead, sell-side analysts expect revenue to grow 7.5% over the next 12 months, a deceleration versus the last three years. Despite the slowdown, this projection is above the sector average and suggests the market is forecasting some success for its newer products.
Software is eating the world and there is virtually no industry left that has been untouched by it. That drives increasing demand for tools helping software developers do their jobs, whether it be monitoring critical cloud infrastructure, integrating audio and video functionality, or ensuring smooth content streaming. Click here to access a free report on our 3 favorite stocks to play this generational megatrend.
Volume Growth
Revenue growth can be broken down into changes in price and volume (the number of units sold). While both are important, volume is the lifeblood of a successful staples business as there’s a ceiling to what consumers will pay for everyday goods; they can always trade down to non-branded products if the branded versions are too expensive.
To analyze whether BellRing Brands generated its growth from changes in price or volume, we can compare its volume growth to its organic revenue growth, which excludes non-fundamental impacts on company financials like mergers and currency fluctuations.
Over the last two years, BellRing Brands’s average quarterly volume growth of 20% has outpaced the competition by a long shot. In the context of its 18.5% average organic revenue growth, we can see that most of the company’s gains have come from more customers purchasing its products.
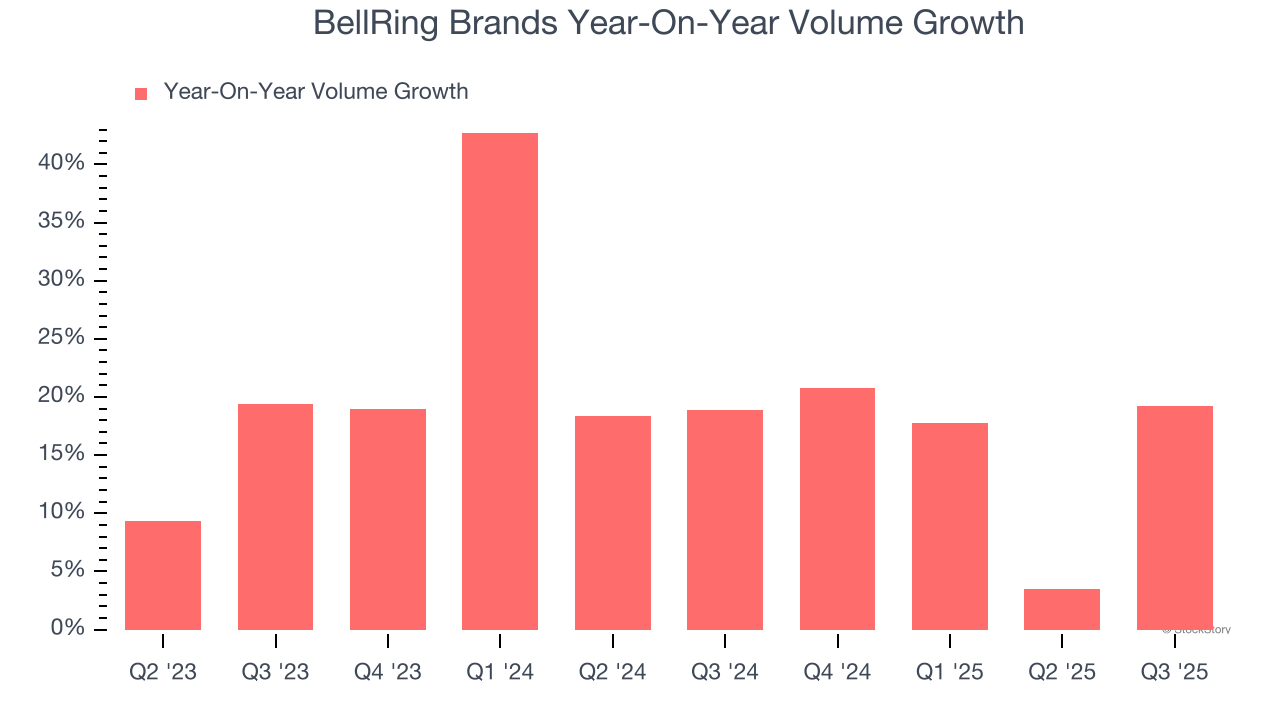
In BellRing Brands’s Q3 2025, sales volumes jumped 19.2% year on year. This result was in line with its historical levels.
Key Takeaways from BellRing Brands’s Q3 Results
We enjoyed seeing BellRing Brands beat analysts’ organic revenue expectations this quarter. We were also happy its revenue outperformed Wall Street’s estimates. On the other hand, its full-year EBITDA guidance missed and its gross margin fell short of Wall Street’s estimates. Overall, this was a softer quarter. The stock traded down 16.2% to $21.47 immediately after reporting.
BellRing Brands underperformed this quarter, but does that create an opportunity to invest right now? If you’re making that decision, you should consider the bigger picture of valuation, business qualities, as well as the latest earnings. We cover that in our actionable full research report which you can read here, it’s free for active Edge members.