
Over the past six months, Regal Rexnord’s shares (currently trading at $129.54) have posted a disappointing 8.3% loss, well below the S&P 500’s 13% gain. This was partly due to its softer quarterly results and may have investors wondering how to approach the situation.
Is there a buying opportunity in Regal Rexnord, or does it present a risk to your portfolio? Check out our in-depth research report to see what our analysts have to say, it’s free for active Edge members.
Why Is Regal Rexnord Not Exciting?
Despite the more favorable entry price, we're cautious about Regal Rexnord. Here are three reasons why RRX doesn't excite us and a stock we'd rather own.
1. Core Business Falling Behind as Demand Declines
In addition to reported revenue, organic revenue is a useful data point for analyzing Engineered Components and Systems companies. This metric gives visibility into Regal Rexnord’s core business because it excludes one-time events such as mergers, acquisitions, and divestitures along with foreign currency fluctuations - non-fundamental factors that can manipulate the income statement.
Over the last two years, Regal Rexnord’s organic revenue averaged 3.6% year-on-year declines. This performance was underwhelming and implies it may need to improve its products, pricing, or go-to-market strategy. It also suggests Regal Rexnord might have to lean into acquisitions to grow, which isn’t ideal because M&A can be expensive and risky (integrations often disrupt focus). 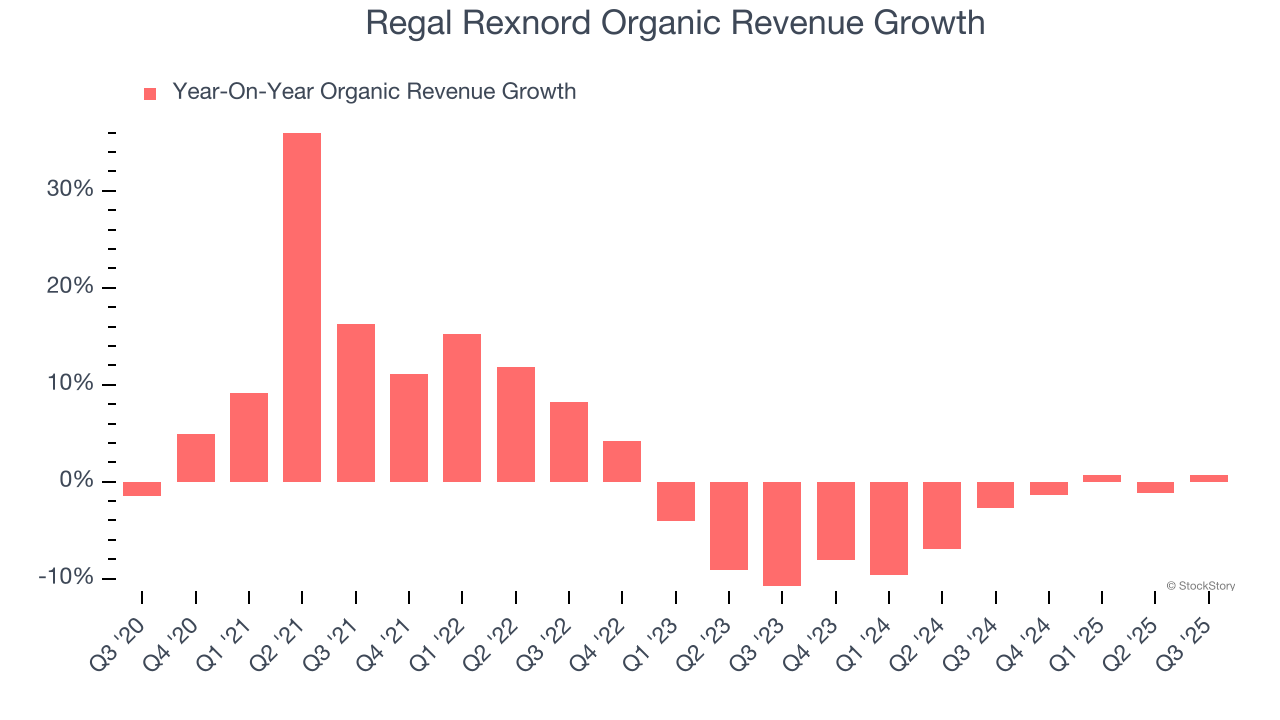
2. EPS Growth Has Stalled Over the Last Two Years
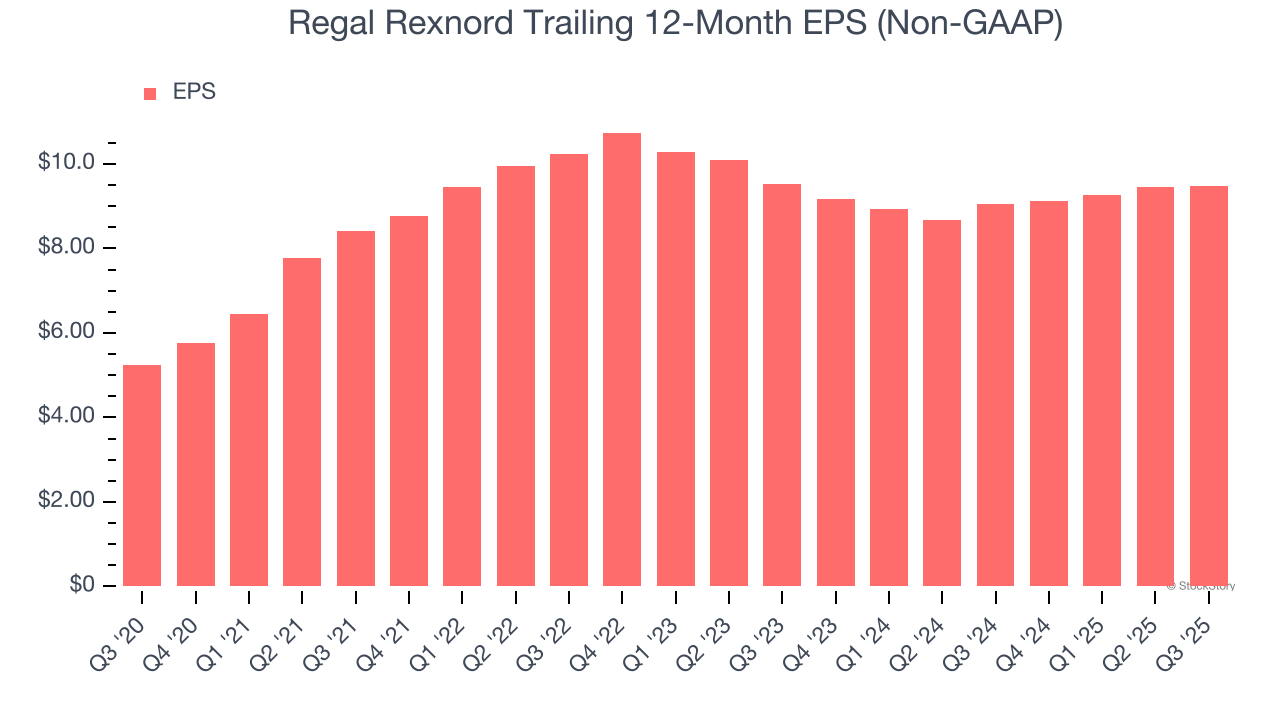
Although long-term earnings trends give us the big picture, we like to analyze EPS over a shorter period to see if we are missing a change in the business.
Regal Rexnord’s EPS was flat over the last two years, just like its revenue. This performance was underwhelming across the board.
3. Previous Growth Initiatives Haven’t Impressed
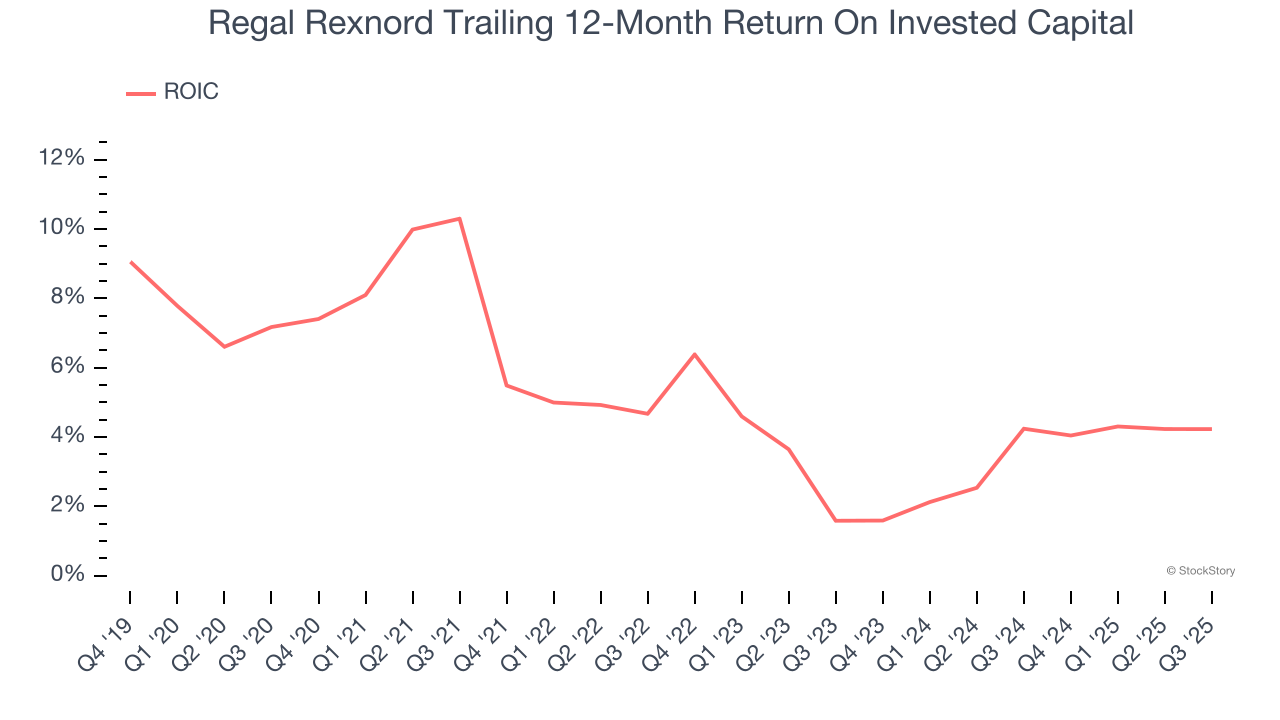
Growth gives us insight into a company’s long-term potential, but how capital-efficient was that growth? A company’s ROIC explains this by showing how much operating profit it makes compared to the money it has raised (debt and equity).
Regal Rexnord historically did a mediocre job investing in profitable growth initiatives. Its five-year average ROIC was 5%, somewhat low compared to the best industrials companies that consistently pump out 20%+.
Final Judgment
Regal Rexnord isn’t a terrible business, but it doesn’t pass our quality test. After the recent drawdown, the stock trades at 12.8× forward P/E (or $129.54 per share). While this valuation is reasonable, we don’t really see a big opportunity at the moment. We're fairly confident there are better stocks to buy right now. Let us point you toward an all-weather company that owns household favorite Taco Bell.
Stocks We Would Buy Instead of Regal Rexnord
If your portfolio success hinges on just 4 stocks, your wealth is built on fragile ground. You have a small window to secure high-quality assets before the market widens and these prices disappear.
Don’t wait for the next volatility shock. Check out our Top 6 Stocks for this week. This is a curated list of our High Quality stocks that have generated a market-beating return of 244% over the last five years (as of June 30, 2025).
Stocks that have made our list include now familiar names such as Nvidia (+1,326% between June 2020 and June 2025) as well as under-the-radar businesses like the once-micro-cap company Tecnoglass (+1,754% five-year return). Find your next big winner with StockStory today.
StockStory is growing and hiring equity analyst and marketing roles. Are you a 0 to 1 builder passionate about the markets and AI? See the open roles here.


