
Over the last six months, FTAI Infrastructure’s shares have sunk to $4.16, producing a disappointing 17% loss - a stark contrast to the S&P 500’s 11.9% gain. This was partly driven by its softer quarterly results and might have investors contemplating their next move.
Following the pullback, is now an opportune time to buy FIP? Find out in our full research report, it’s free for active Edge members.
Why Does FIP Stock Spark Debate?
Spun off from FTAI Aviation in 2021, FTAI Infrastructure (NASDAQ: FIP) invests in and operates infrastructure and related assets across the transportation and energy sectors.
Two Things to Like:
1. Skyrocketing Revenue Shows Strong Momentum
A company’s long-term sales performance can indicate its overall quality. Any business can experience short-term success, but top-performing ones enjoy sustained growth for years. Over the last four years, FTAI Infrastructure grew its sales at an incredible 49.1% compounded annual growth rate. Its growth surpassed the average industrials company and shows its offerings resonate with customers.
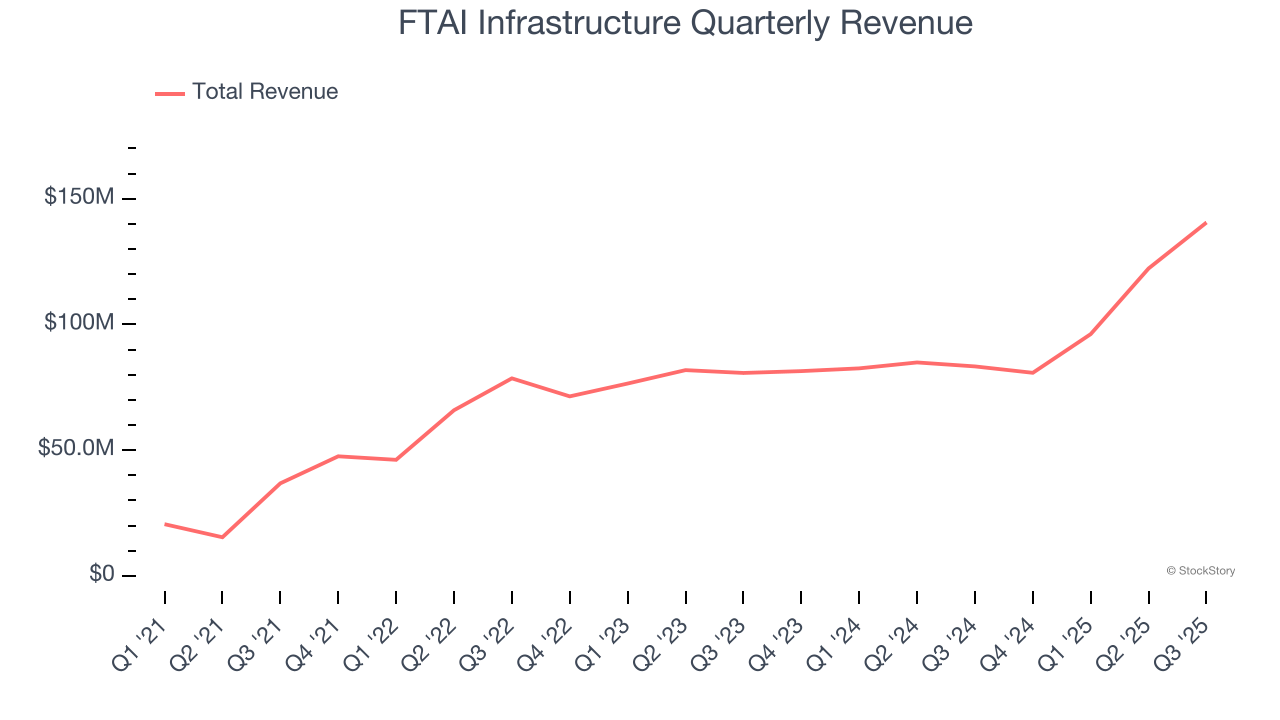
2. Projected Revenue Growth Is Remarkable
Forecasted revenues by Wall Street analysts signal a company’s potential. Predictions may not always be accurate, but accelerating growth typically boosts valuation multiples and stock prices while slowing growth does the opposite, though some deceleration is natural as businesses become larger.
Over the next 12 months, sell-side analysts expect FTAI Infrastructure’s revenue to rise by 73.5%, an improvement versus its 49.1% annualized growth for the past four years. This projection is eye-popping and implies its newer products and services will catalyze better top-line performance.
One Reason to be Careful:
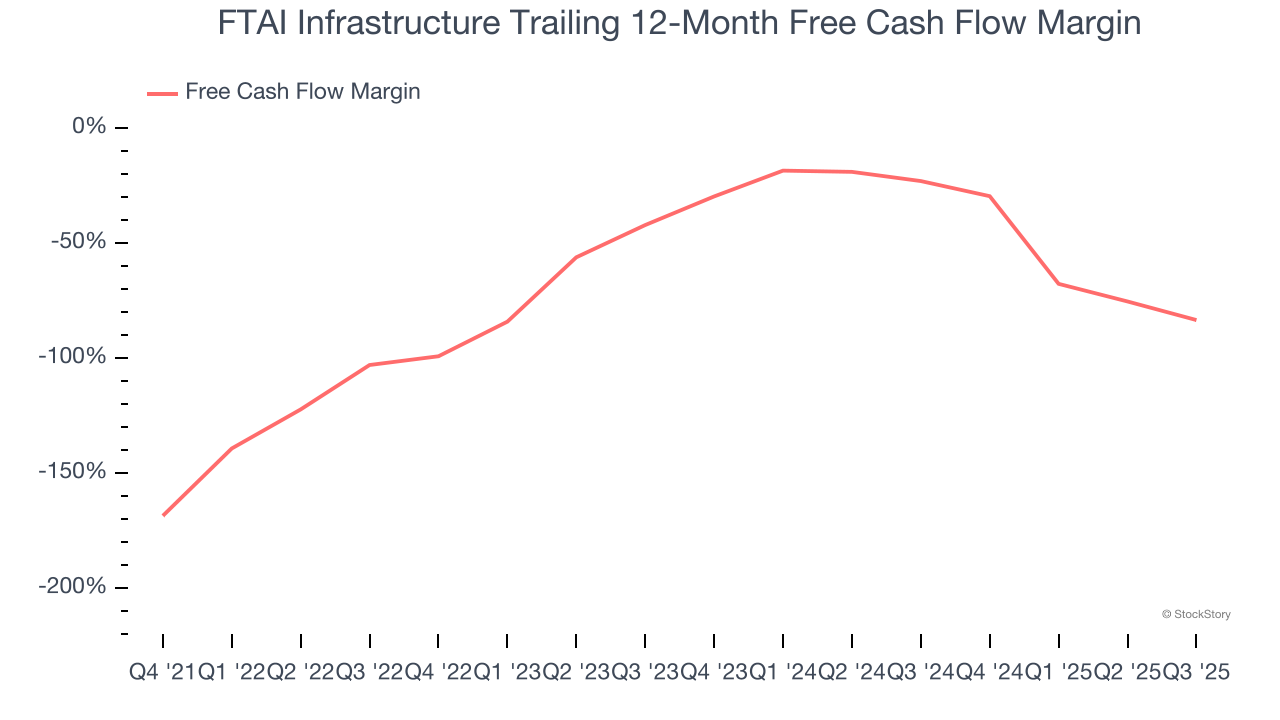
Cash Burn Ignites Concerns
Free cash flow isn't a prominently featured metric in company financials and earnings releases, but we think it's telling because it accounts for all operating and capital expenses, making it tough to manipulate. Cash is king.
FTAI Infrastructure’s demanding reinvestments have drained its resources over the last five years, putting it in a pinch and limiting its ability to return capital to investors. Its free cash flow margin averaged negative 70.8%, meaning it lit $70.83 of cash on fire for every $100 in revenue.
Final Judgment
FTAI Infrastructure has huge potential even though it has some open questions. After the recent drawdown, the stock trades at 1.4× forward EV-to-EBITDA (or $4.16 per share). Is now a good time to buy? See for yourself in our full research report, it’s free for active Edge members.
High-Quality Stocks for All Market Conditions
If your portfolio success hinges on just 4 stocks, your wealth is built on fragile ground. You have a small window to secure high-quality assets before the market widens and these prices disappear.
Don’t wait for the next volatility shock. Check out our Top 5 Strong Momentum Stocks for this week. This is a curated list of our High Quality stocks that have generated a market-beating return of 244% over the last five years (as of June 30, 2025).
Stocks that have made our list include now familiar names such as Nvidia (+1,326% between June 2020 and June 2025) as well as under-the-radar businesses like the once-small-cap company Exlservice (+354% five-year return). Find your next big winner with StockStory today.
StockStory is growing and hiring equity analyst and marketing roles. Are you a 0 to 1 builder passionate about the markets and AI? See the open roles here.


