
Dayforce’s 17.4% return over the past six months has outpaced the S&P 500 by 6%, and its stock price has climbed to $69.05 per share. This run-up might have investors contemplating their next move.
Is now the time to buy Dayforce, or should you be careful about including it in your portfolio? Get the full stock story straight from our expert analysts, it’s free for active Edge members.
Why Is Dayforce Not Exciting?
We’re happy investors have made money, but we're cautious about Dayforce. Here are three reasons we avoid DAY and a stock we'd rather own.
1. Weak Billings Point to Soft Demand
Billings is a non-GAAP metric that is often called “cash revenue” because it shows how much money the company has collected from customers in a certain period. This is different from revenue, which must be recognized in pieces over the length of a contract.
Dayforce’s billings came in at $473.8 million in Q3, and over the last four quarters, its year-on-year growth averaged 12%. This performance was underwhelming and suggests that increasing competition is causing challenges in acquiring/retaining customers. 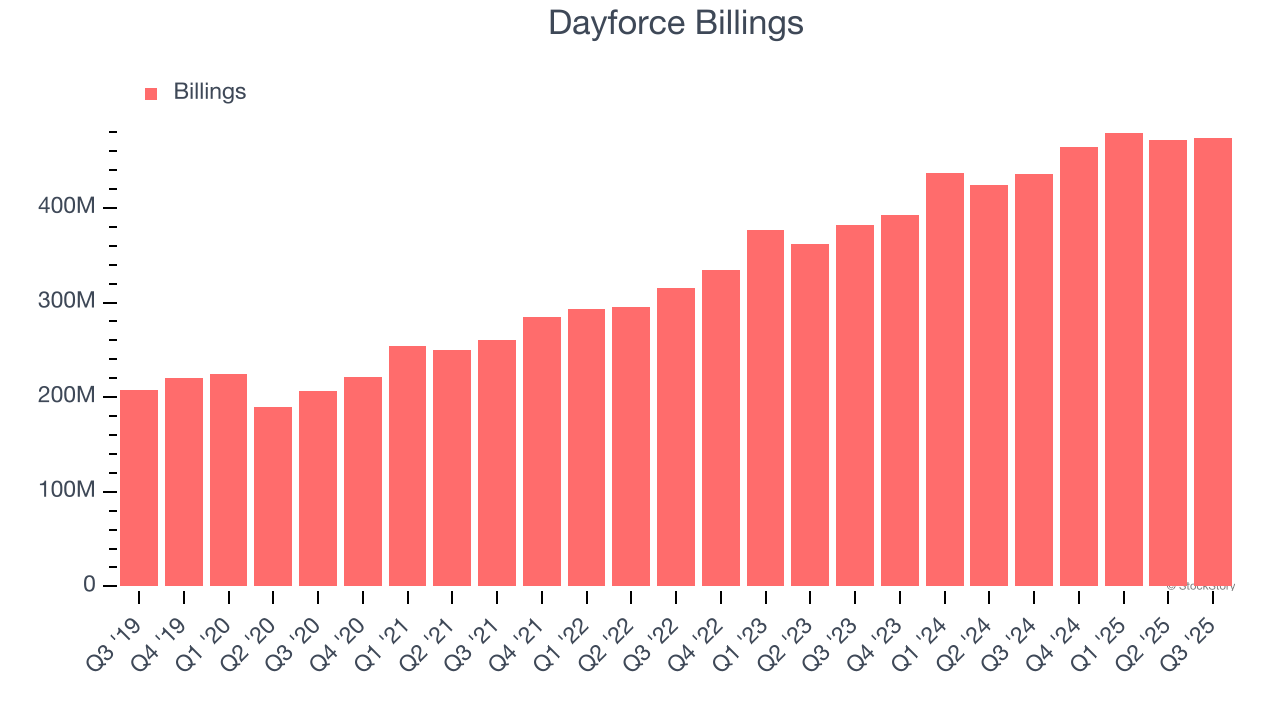
2. Low Gross Margin Reveals Weak Structural Profitability
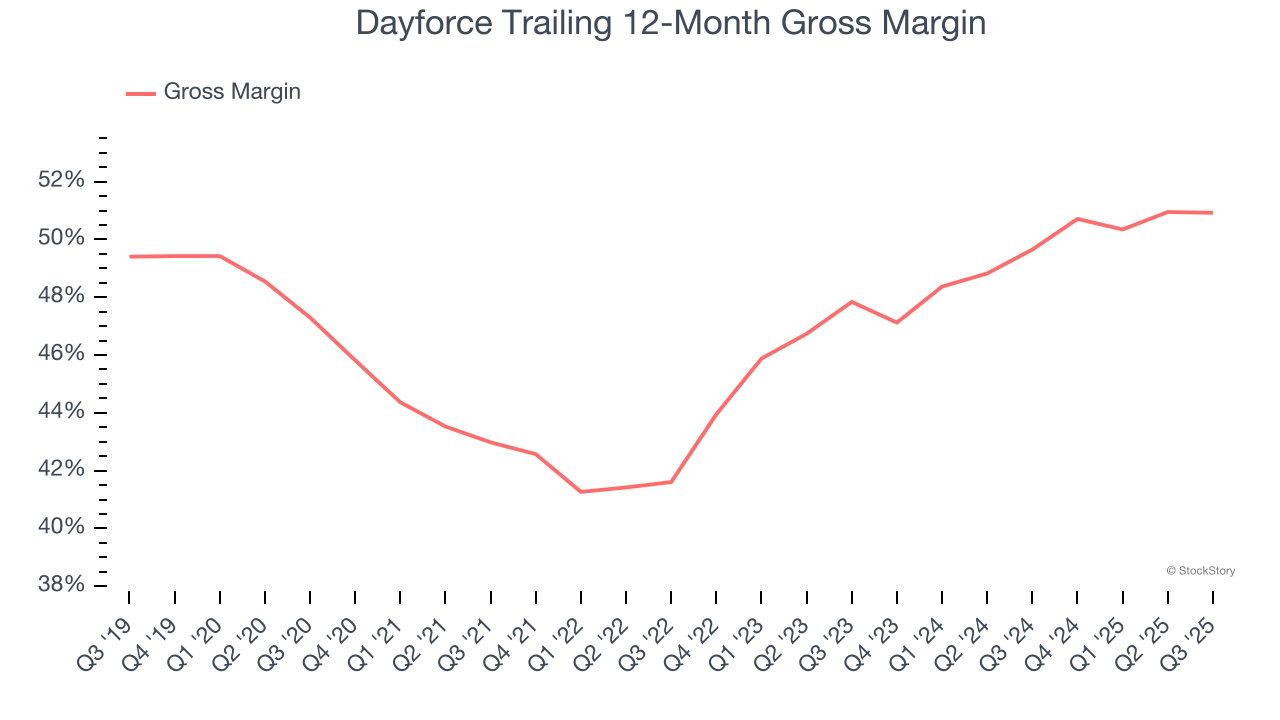
For software companies like Dayforce, gross profit tells us how much money remains after paying for the base cost of products and services (typically servers, licenses, and certain personnel). These costs are usually low as a percentage of revenue, explaining why software is more lucrative than other sectors.
Dayforce’s gross margin is substantially worse than most software businesses, signaling it has relatively high infrastructure costs compared to asset-lite businesses like ServiceNow. As you can see below, it averaged a 50.9% gross margin over the last year. Said differently, Dayforce had to pay a chunky $49.08 to its service providers for every $100 in revenue.
The market not only cares about gross margin levels but also how they change over time because expansion creates firepower for profitability and free cash generation. Dayforce has seen gross margins improve by 3.1 percentage points over the last 2 year, which is very good in the software space.
3. Operating Margin in Limbo
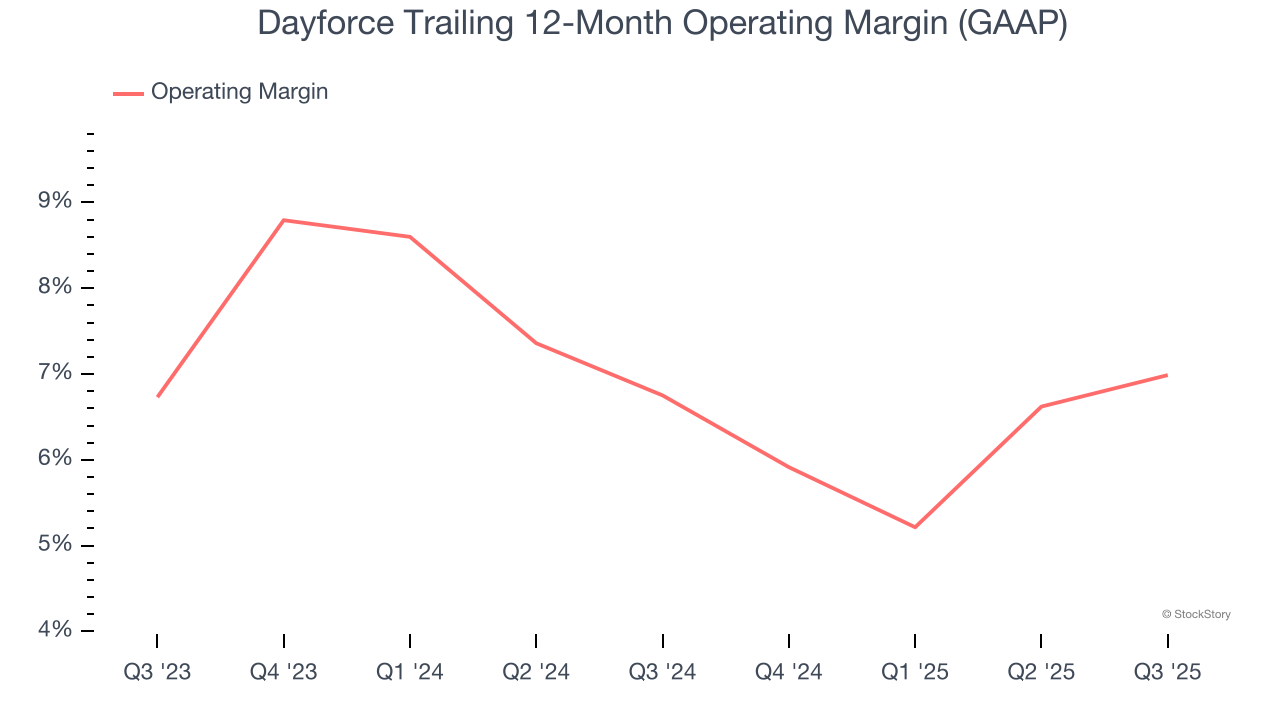
Many software businesses adjust their profits for stock-based compensation (SBC), but we prioritize GAAP operating margin because SBC is a real expense used to attract and retain engineering and sales talent. This is one of the best measures of profitability because it shows how much money a company takes home after developing, marketing, and selling its products.
Looking at the trend in its profitability, Dayforce’s operating margin might fluctuated slightly but has generally stayed the same over the last two years. This raises questions about the company’s expense base because its revenue growth should have given it leverage on its fixed costs, resulting in better economies of scale and profitability. Its operating margin for the trailing 12 months was 7%.
Final Judgment
Dayforce isn’t a terrible business, but it doesn’t pass our quality test. With its shares topping the market in recent months, the stock trades at 5.2× forward price-to-sales (or $69.05 per share). This valuation multiple is fair, but we don’t have much faith in the company. We're fairly confident there are better stocks to buy right now. We’d recommend looking at a dominant Aerospace business that has perfected its M&A strategy.
High-Quality Stocks for All Market Conditions
If your portfolio success hinges on just 4 stocks, your wealth is built on fragile ground. You have a small window to secure high-quality assets before the market widens and these prices disappear.
Don’t wait for the next volatility shock. Check out our Top 5 Strong Momentum Stocks for this week. This is a curated list of our High Quality stocks that have generated a market-beating return of 244% over the last five years (as of June 30, 2025).
Stocks that have made our list include now familiar names such as Nvidia (+1,326% between June 2020 and June 2025) as well as under-the-radar businesses like the once-micro-cap company Tecnoglass (+1,754% five-year return). Find your next big winner with StockStory today.
StockStory is growing and hiring equity analyst and marketing roles. Are you a 0 to 1 builder passionate about the markets and AI? See the open roles here.


