General Dynamics’s 22% return over the past six months has outpaced the S&P 500 by 10.6%, and its stock price has climbed to $343.43 per share. This was partly due to its solid quarterly results, and the run-up might have investors contemplating their next move.
Is there a buying opportunity in General Dynamics, or does it present a risk to your portfolio? Get the full breakdown from our expert analysts, it’s free for active Edge members.
Why Is General Dynamics Not Exciting?
Despite the momentum, we're sitting this one out for now. Here are three reasons you should be careful with GD and a stock we'd rather own.
1. Weak Backlog Growth Points to Soft Demand
In addition to reported revenue, backlog is a useful data point for analyzing Defense Contractors companies. This metric shows the value of outstanding orders that have not yet been executed or delivered, giving visibility into General Dynamics’s future revenue streams.
General Dynamics’s backlog came in at $109.9 billion in the latest quarter, and over the last two years, its year-on-year growth averaged 3.4%. This performance was underwhelming and suggests that increasing competition is causing challenges in winning new orders. 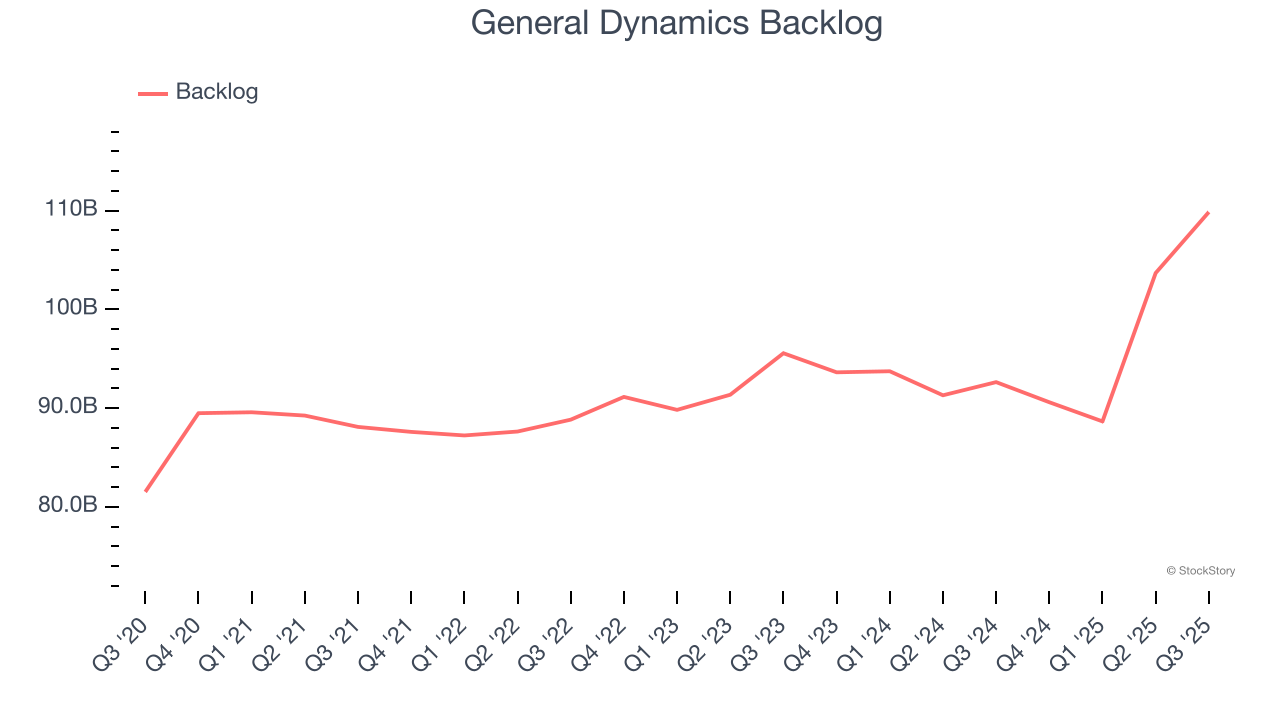
2. Projected Revenue Growth Is Slim
Forecasted revenues by Wall Street analysts signal a company’s potential. Predictions may not always be accurate, but accelerating growth typically boosts valuation multiples and stock prices while slowing growth does the opposite.
Over the next 12 months, sell-side analysts expect General Dynamics’s revenue to rise by 4%, a deceleration versus its 6.2% annualized growth for the past five years. This projection is underwhelming and suggests its products and services will face some demand challenges.
3. Free Cash Flow Margin Dropping
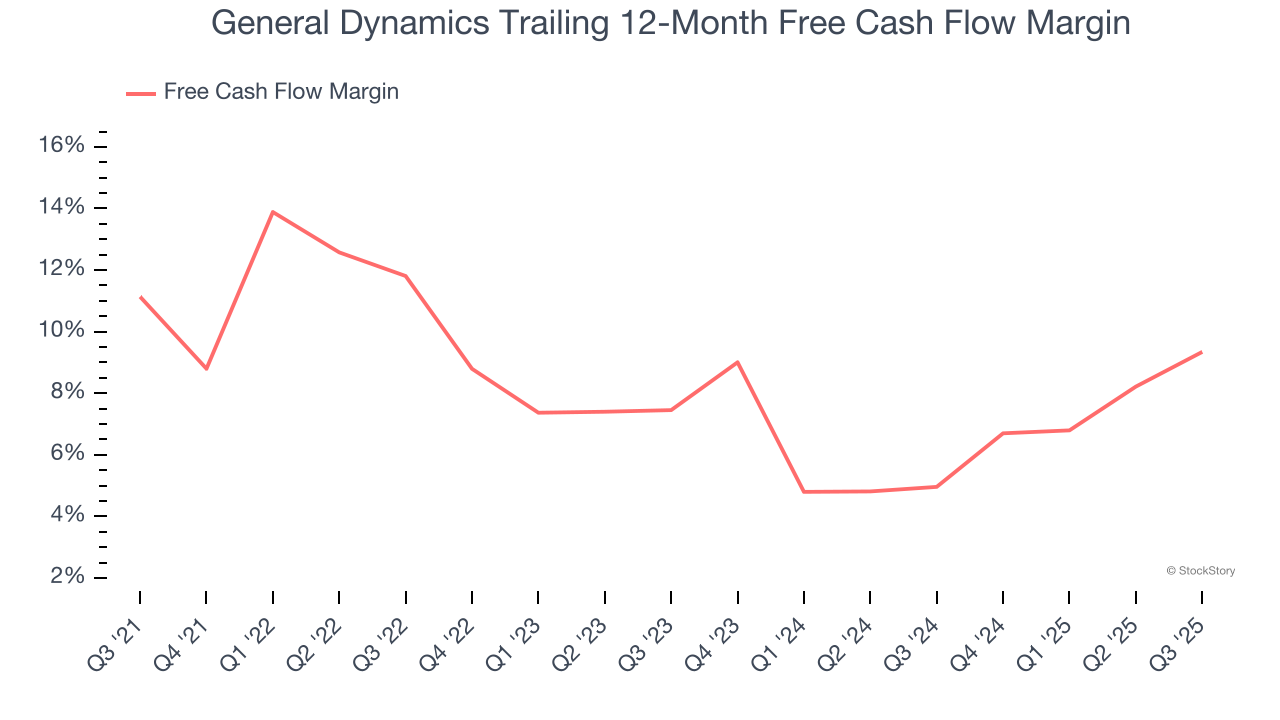
Free cash flow isn't a prominently featured metric in company financials and earnings releases, but we think it's telling because it accounts for all operating and capital expenses, making it tough to manipulate. Cash is king.
As you can see below, General Dynamics’s margin dropped by 1.8 percentage points over the last five years. It may have ticked higher more recently, but shareholders are likely hoping for its margin to at least revert to its historical level. If the longer-term trend returns, it could signal increasing investment needs and capital intensity. General Dynamics’s free cash flow margin for the trailing 12 months was 9.3%.
Final Judgment
General Dynamics’s business quality ultimately falls short of our standards. With its shares topping the market in recent months, the stock trades at 20.8× forward P/E (or $343.43 per share). This valuation multiple is fair, but we don’t have much faith in the company. We're fairly confident there are better investments elsewhere. We’d recommend looking at a fast-growing restaurant franchise with an A+ ranch dressing sauce.
Stocks We Like More Than General Dynamics
The market’s up big this year - but there’s a catch. Just 4 stocks account for half the S&P 500’s entire gain. That kind of concentration makes investors nervous, and for good reason. While everyone piles into the same crowded names, smart investors are hunting quality where no one’s looking - and paying a fraction of the price. Check out the high-quality names we’ve flagged in our Top 9 Market-Beating Stocks. This is a curated list of our High Quality stocks that have generated a market-beating return of 244% over the last five years (as of June 30, 2025).
Stocks that have made our list include now familiar names such as Nvidia (+1,326% between June 2020 and June 2025) as well as under-the-radar businesses like the once-small-cap company Exlservice (+354% five-year return). Find your next big winner with StockStory today.
StockStory is growing and hiring equity analyst and marketing roles. Are you a 0 to 1 builder passionate about the markets and AI? See the open roles here.


