
Life sciences cloud software provider Veeva Systems (NYSE: VEEV) reported Q3 CY2025 results exceeding the market’s revenue expectations, with sales up 16% year on year to $811.2 million. Guidance for next quarter’s revenue was better than expected at $808.5 million at the midpoint, 1% above analysts’ estimates. Its non-GAAP profit of $2.04 per share was 4.5% above analysts’ consensus estimates.
Is now the time to buy Veeva Systems? Find out by accessing our full research report, it’s free for active Edge members.
Veeva Systems (VEEV) Q3 CY2025 Highlights:
- Revenue: $811.2 million vs analyst estimates of $792.9 million (16% year-on-year growth, 2.3% beat)
- Adjusted EPS: $2.04 vs analyst estimates of $1.95 (4.5% beat)
- Adjusted Operating Income: $364.9 million vs analyst estimates of $350.3 million (45% margin, 4.2% beat)
- Revenue Guidance for Q4 CY2025 is $808.5 million at the midpoint, above analyst estimates of $800.5 million
- Management raised its full-year Adjusted EPS guidance to $7.93 at the midpoint, a 1.9% increase
- Operating Margin: 29.7%, up from 25.9% in the same quarter last year
- Free Cash Flow Margin: 23.8%, down from 29.4% in the previous quarter
- Market Capitalization: $44.75 billion
Company Overview
Originally named "Verticals onDemand" before rebranding in 2009, Veeva Systems (NYSE: VEEV) provides cloud software, data solutions, and consulting services that help life sciences companies develop and bring products to market more efficiently.
Revenue Growth
A company’s long-term sales performance is one signal of its overall quality. Even a bad business can shine for one or two quarters, but a top-tier one grows for years. Over the last five years, Veeva Systems grew its sales at a 17.4% annual rate. Although this growth is acceptable on an absolute basis, it fell slightly short of our standards for the software sector, which enjoys a number of secular tailwinds. Luckily, there are other things to like about Veeva Systems.
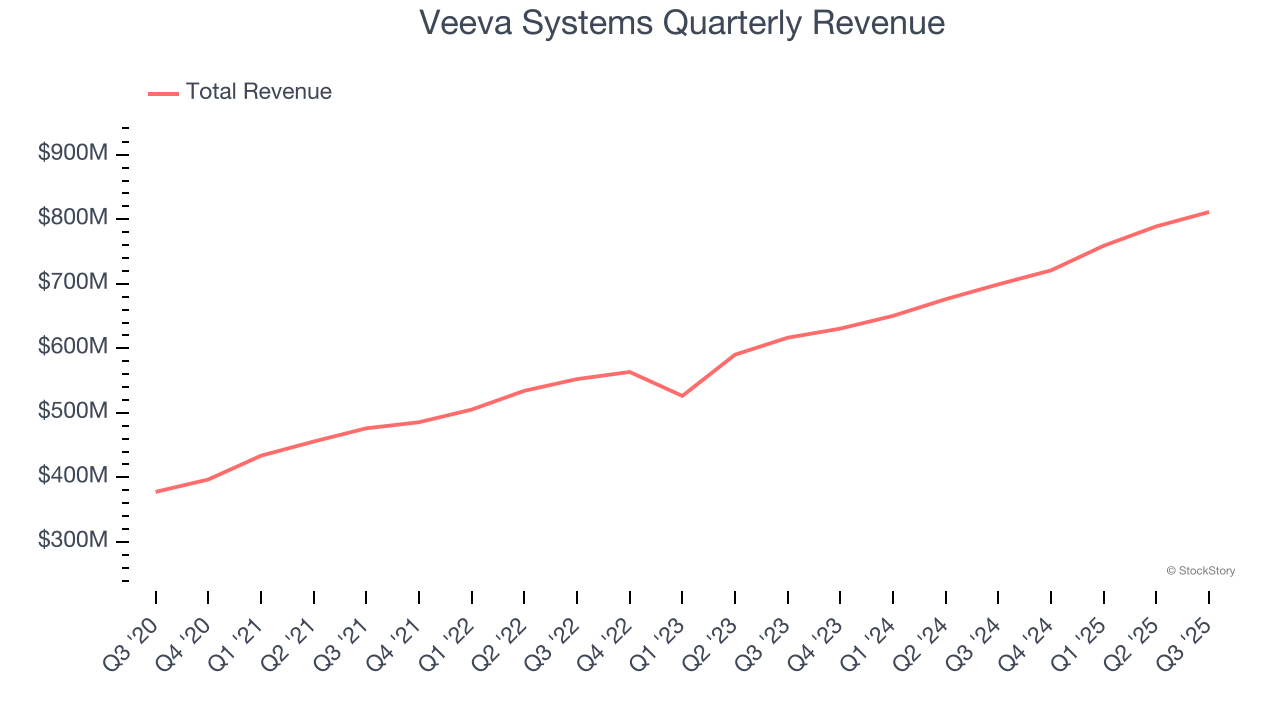
Long-term growth is the most important, but within software, a half-decade historical view may miss new innovations or demand cycles. Veeva Systems’s annualized revenue growth of 15.8% over the last two years is below its five-year trend, but we still think the results were respectable. 
This quarter, Veeva Systems reported year-on-year revenue growth of 16%, and its $811.2 million of revenue exceeded Wall Street’s estimates by 2.3%. Company management is currently guiding for a 12.2% year-on-year increase in sales next quarter.
Looking further ahead, sell-side analysts expect revenue to grow 10.8% over the next 12 months, a deceleration versus the last two years. This projection is underwhelming and suggests its products and services will see some demand headwinds. At least the company is tracking well in other measures of financial health.
Software is eating the world and there is virtually no industry left that has been untouched by it. That drives increasing demand for tools helping software developers do their jobs, whether it be monitoring critical cloud infrastructure, integrating audio and video functionality, or ensuring smooth content streaming. Click here to access a free report on our 3 favorite stocks to play this generational megatrend.
Customer Acquisition Efficiency
The customer acquisition cost (CAC) payback period represents the months required to recover the cost of acquiring a new customer. Essentially, it’s the break-even point for sales and marketing investments. A shorter CAC payback period is ideal, as it implies better returns on investment and business scalability.
Veeva Systems is extremely efficient at acquiring new customers, and its CAC payback period checked in at 15.3 months this quarter. The company’s rapid recovery of its customer acquisition costs indicates it has a highly differentiated product offering and a strong brand reputation. These dynamics give Veeva Systems more resources to pursue new product initiatives while maintaining the flexibility to increase its sales and marketing investments. 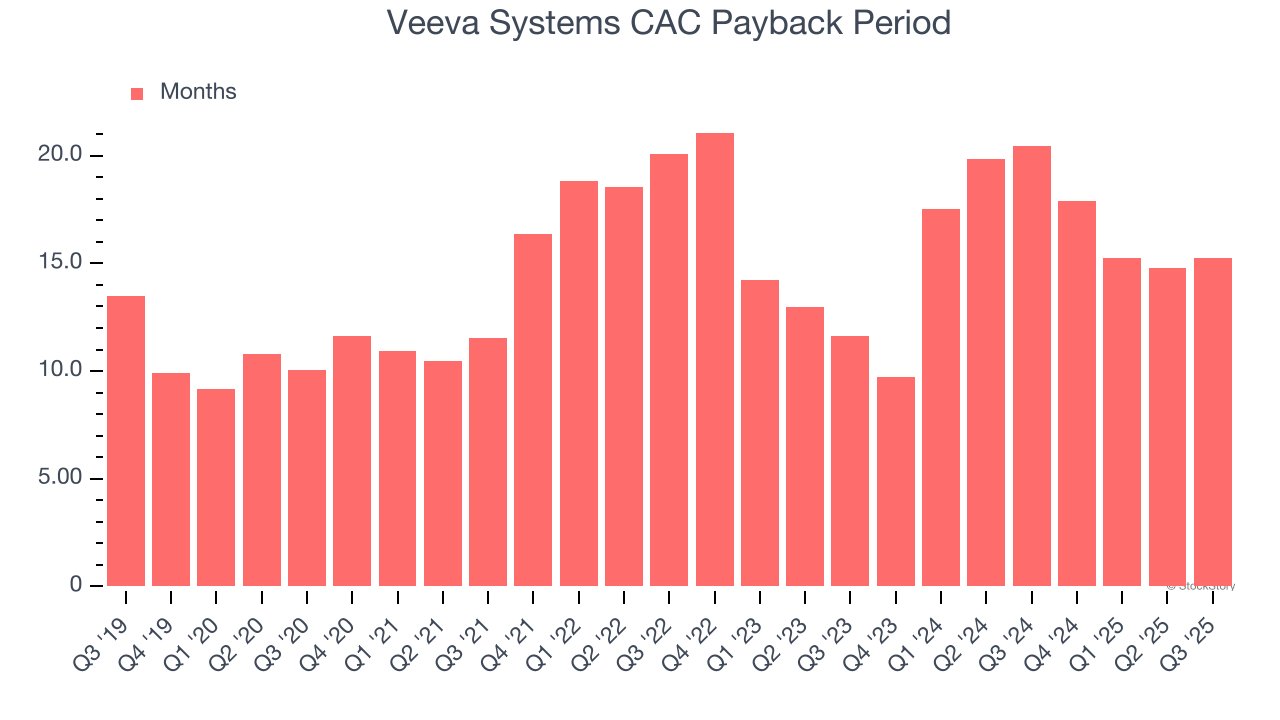
Key Takeaways from Veeva Systems’s Q3 Results
It was great to see Veeva Systems’s full-year EPS guidance top analysts’ expectations. We were also glad its EPS guidance for next quarter slightly exceeded Wall Street’s estimates. Overall, this print had some key positives. Investors were likely hoping for more, and shares traded down 2.7% to $263.38 immediately after reporting.
Should you buy the stock or not? We think that the latest quarter is only one piece of the longer-term business quality puzzle. Quality, when combined with valuation, can help determine if the stock is a buy. We cover that in our actionable full research report which you can read here, it’s free for active Edge members.


