
Since May 2025, EPAM has been in a holding pattern, posting a small return of 2.5% while floating around $181.12. The stock also fell short of the S&P 500’s 10.4% gain during that period.
Is now the time to buy EPAM? Find out in our full research report, it’s free for active Edge members.
Why Does EPAM Stock Spark Debate?
Founded in 1993 during the early days of offshore software development, EPAM Systems (NYSE: EPAM) provides digital engineering, cloud, and AI transformation services to help global enterprises and startups modernize their technology systems and create digital products.
Two Things to Like:
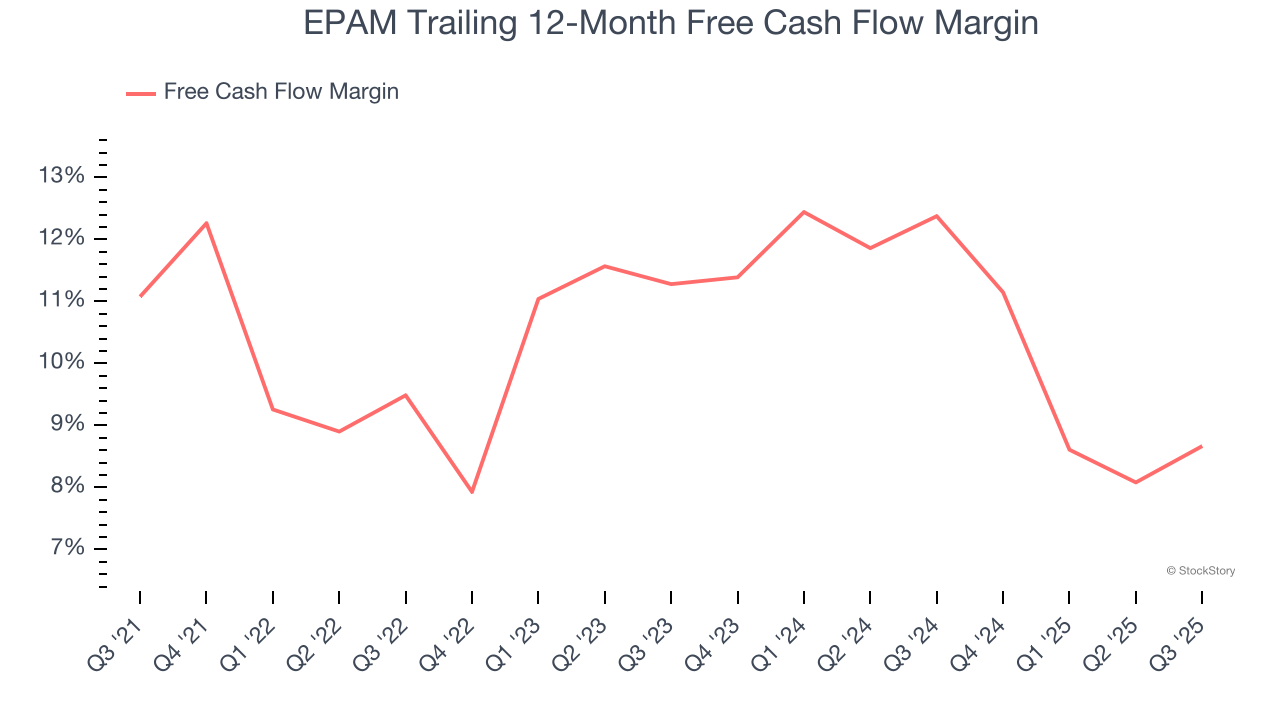
1. Excellent Free Cash Flow Margin Boosts Reinvestment Potential
If you’ve followed StockStory for a while, you know we emphasize free cash flow. Why, you ask? We believe that in the end, cash is king, and you can’t use accounting profits to pay the bills.
EPAM has shown robust cash profitability, giving it an edge over its competitors and the ability to reinvest or return capital to investors. The company’s free cash flow margin averaged 10.5% over the last five years, quite impressive for a business services business.
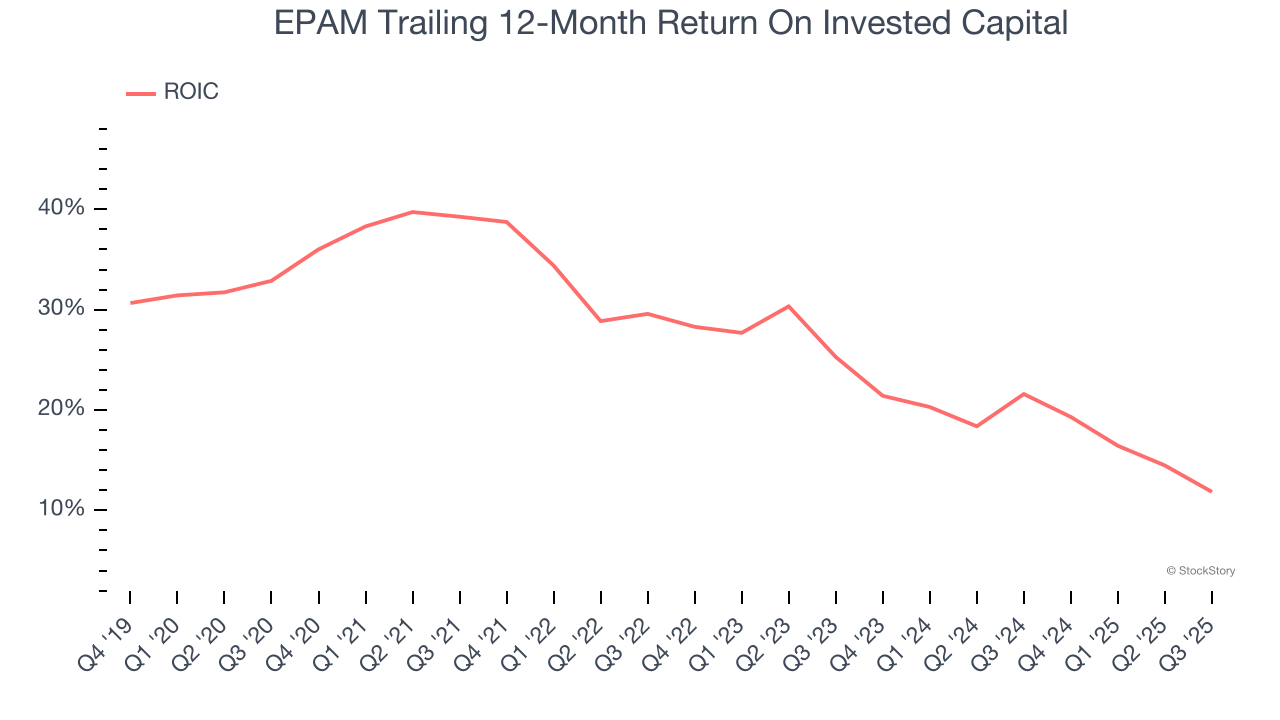
2. Stellar ROIC Showcases Lucrative Growth Opportunities
Growth gives us insight into a company’s long-term potential, but how capital-efficient was that growth? Enter ROIC, a metric showing how much operating profit a company generates relative to the money it has raised (debt and equity).
EPAM’s five-year average ROIC was 25.5%, placing it among the best business services companies. This illustrates its management team’s ability to invest in highly profitable ventures and produce tangible results for shareholders.

One Reason to be Careful:
New Investments Fail to Bear Fruit as ROIC Declines
A company’s ROIC, or return on invested capital, shows how much operating profit it makes compared to the money it has raised (debt and equity).
We like to invest in businesses with high returns, but the trend in a company’s ROIC is what often surprises the market and moves the stock price. Over the last few years, EPAM’s ROIC has unfortunately decreased significantly. Only time will tell if its new bets can bear fruit and potentially reverse the trend.
Final Judgment
EPAM’s merits more than compensate for its flaws. With its shares trailing the market in recent months, the stock trades at 14.5× forward P/E (or $181.12 per share). Is now a good time to initiate a position? See for yourself in our full research report, it’s free for active Edge members.
Stocks We Like Even More Than EPAM
Your portfolio can’t afford to be based on yesterday’s story. The risk in a handful of heavily crowded stocks is rising daily.
The names generating the next wave of massive growth are right here in our Top 6 Stocks for this week. This is a curated list of our High Quality stocks that have generated a market-beating return of 244% over the last five years (as of June 30, 2025).
Stocks that have made our list include now familiar names such as Nvidia (+1,326% between June 2020 and June 2025) as well as under-the-radar businesses like the once-small-cap company Comfort Systems (+782% five-year return). Find your next big winner with StockStory today.
StockStory is growing and hiring equity analyst and marketing roles. Are you a 0 to 1 builder passionate about the markets and AI? See the open roles here.


