
Gartner’s stock price has taken a beating over the past six months, shedding 47.3% of its value and falling to $234.30 per share. This may have investors wondering how to approach the situation.
Is there a buying opportunity in Gartner, or does it present a risk to your portfolio? Get the full breakdown from our expert analysts, it’s free for active Edge members.
Why Is Gartner Not Exciting?
Even though the stock has become cheaper, we're sitting this one out for now. Here are three reasons we avoid IT and a stock we'd rather own.
1. Projected Revenue Growth Is Slim
Forecasted revenues by Wall Street analysts signal a company’s potential. Predictions may not always be accurate, but accelerating growth typically boosts valuation multiples and stock prices while slowing growth does the opposite.
Over the next 12 months, sell-side analysts expect Gartner’s revenue to rise by 2.7%, a slight deceleration versus its 9% annualized growth for the past five years. This projection is underwhelming and suggests its products and services will face some demand challenges.
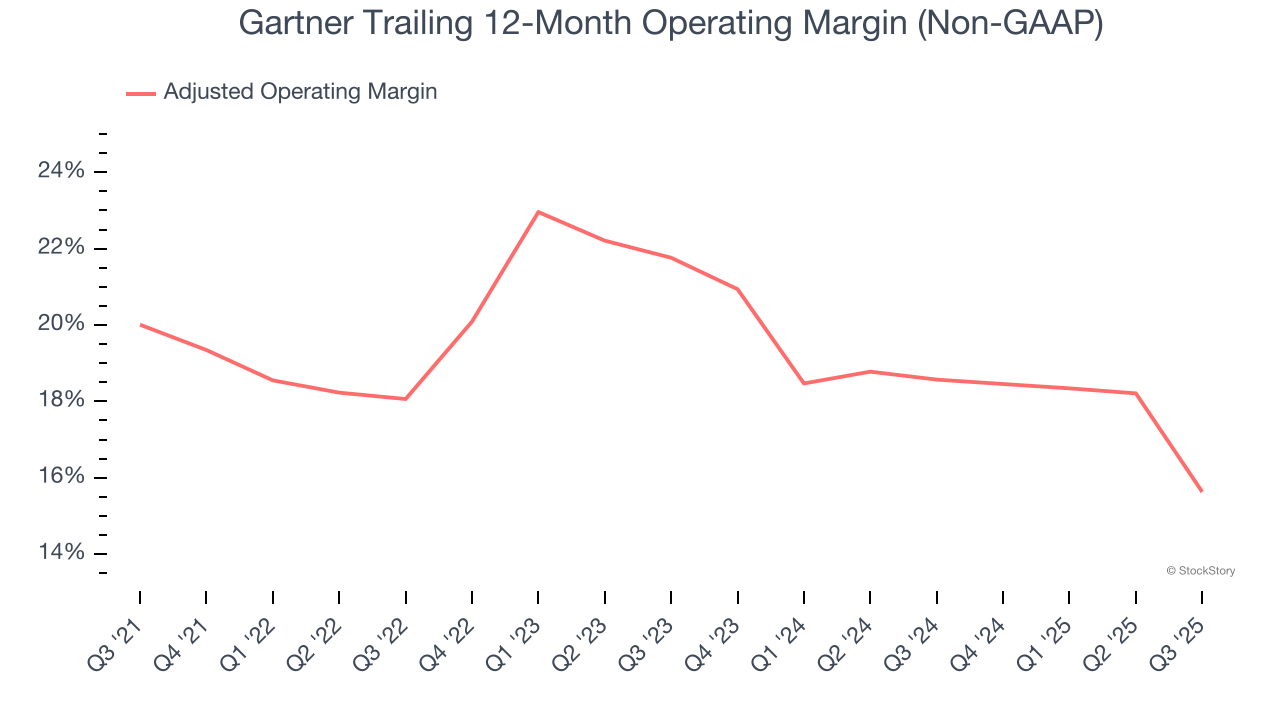
2. Shrinking Adjusted Operating Margin
Adjusted operating margin is an important measure of profitability as it shows the portion of revenue left after accounting for all core expenses – everything from the cost of goods sold to advertising and wages. It’s also useful for comparing profitability across companies because it excludes non-recurring expenses, interest on debt, and taxes.
Analyzing the trend in its profitability, Gartner’s adjusted operating margin decreased by 4.4 percentage points over the last five years. This raises questions about the company’s expense base because its revenue growth should have given it leverage on its fixed costs, resulting in better economies of scale and profitability. Its adjusted operating margin for the trailing 12 months was 15.6%.
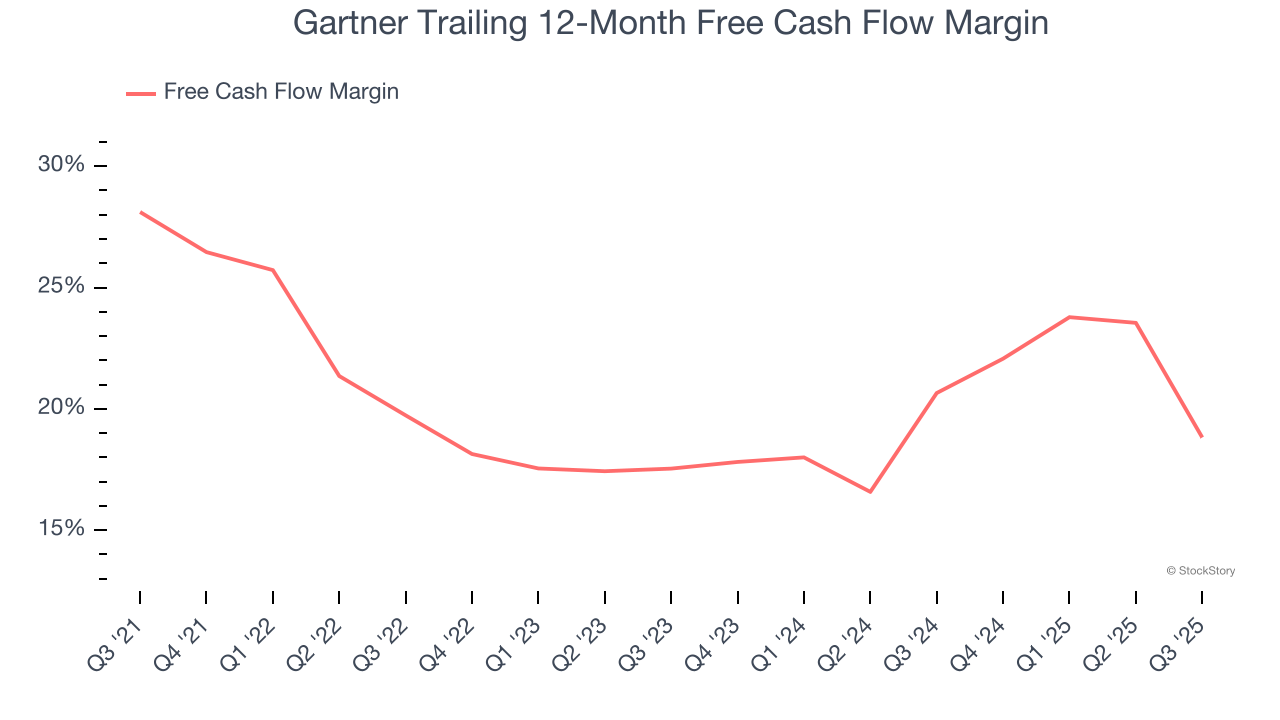
3. Free Cash Flow Margin Dropping
Free cash flow isn't a prominently featured metric in company financials and earnings releases, but we think it's telling because it accounts for all operating and capital expenses, making it tough to manipulate. Cash is king.
As you can see below, Gartner’s margin dropped by 9.3 percentage points over the last five years. If its declines continue, it could signal increasing investment needs and capital intensity. Gartner’s free cash flow margin for the trailing 12 months was 18.8%.
Final Judgment
Gartner isn’t a terrible business, but it doesn’t pass our quality test. Following the recent decline, the stock trades at 17× forward P/E (or $234.30 per share). This valuation is reasonable, but the company’s shakier fundamentals present too much downside risk. We're fairly confident there are better stocks to buy right now. We’d suggest looking at a top digital advertising platform riding the creator economy.
Stocks We Would Buy Instead of Gartner
If your portfolio success hinges on just 4 stocks, your wealth is built on fragile ground. You have a small window to secure high-quality assets before the market widens and these prices disappear.
Don’t wait for the next volatility shock. Check out our Top 9 Market-Beating Stocks. This is a curated list of our High Quality stocks that have generated a market-beating return of 244% over the last five years (as of June 30, 2025).
Stocks that have made our list include now familiar names such as Nvidia (+1,326% between June 2020 and June 2025) as well as under-the-radar businesses like the once-micro-cap company Tecnoglass (+1,754% five-year return). Find your next big winner with StockStory today.
StockStory is growing and hiring equity analyst and marketing roles. Are you a 0 to 1 builder passionate about the markets and AI? See the open roles here.


