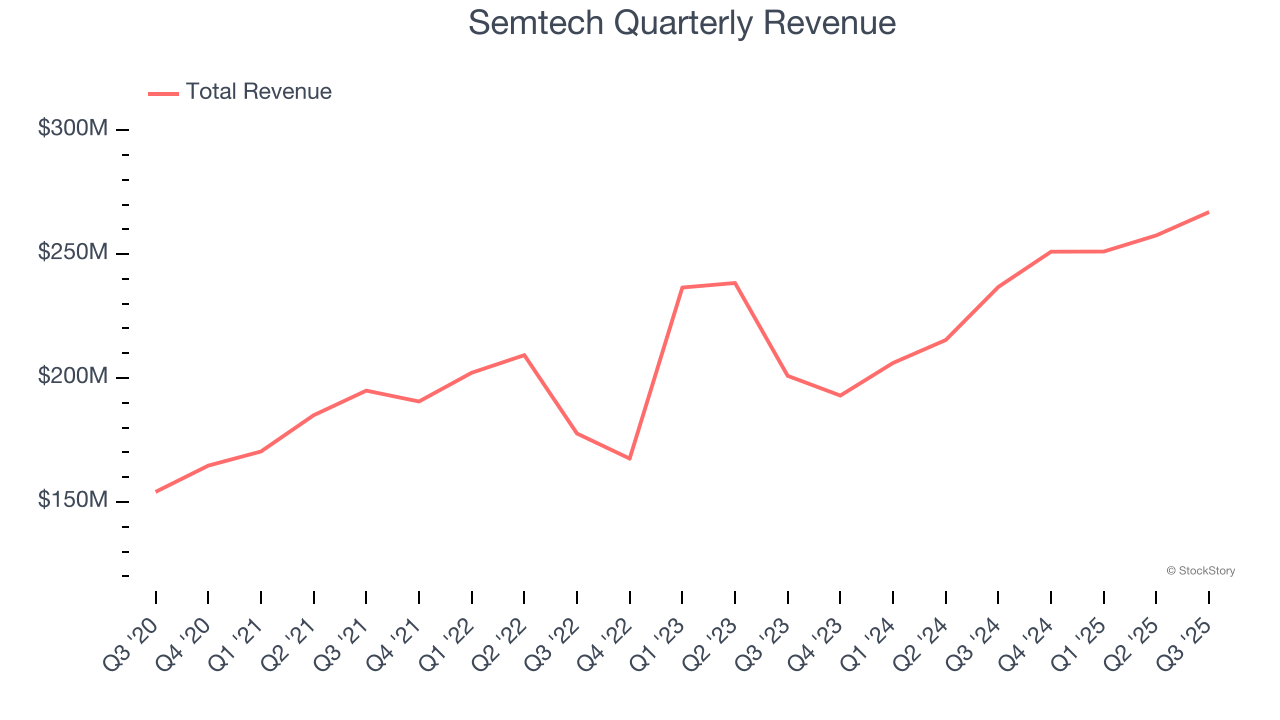
Semiconductor company Semtech (NASDAQ: SMTC) met Wall Streets revenue expectations in Q3 CY2025, with sales up 12.8% year on year to $267 million. The company expects next quarter’s revenue to be around $273 million, coming in 2.7% above analysts’ estimates. Its non-GAAP profit of $0.48 per share was 7.9% above analysts’ consensus estimates.
Is now the time to buy Semtech? Find out by accessing our full research report, it’s free for active Edge members.
Semtech (SMTC) Q3 CY2025 Highlights:
- Revenue: $267 million vs analyst estimates of $266.6 million (12.8% year-on-year growth, in line)
- Adjusted EPS: $0.48 vs analyst estimates of $0.45 (7.9% beat)
- Adjusted EBITDA: $62.7 million vs analyst estimates of $60.14 million (23.5% margin, 4.3% beat)
- Revenue Guidance for Q4 CY2025 is $273 million at the midpoint, above analyst estimates of $265.9 million
- Adjusted EPS guidance for Q4 CY2025 is $0.43 at the midpoint, below analyst estimates of $0.44
- EBITDA guidance for Q4 CY2025 is $56 million at the midpoint, below analyst estimates of $58.79 million
- Operating Margin: 11.6%, up from 7.5% in the same quarter last year
- Free Cash Flow Margin: 16.7%, up from 12.3% in the same quarter last year
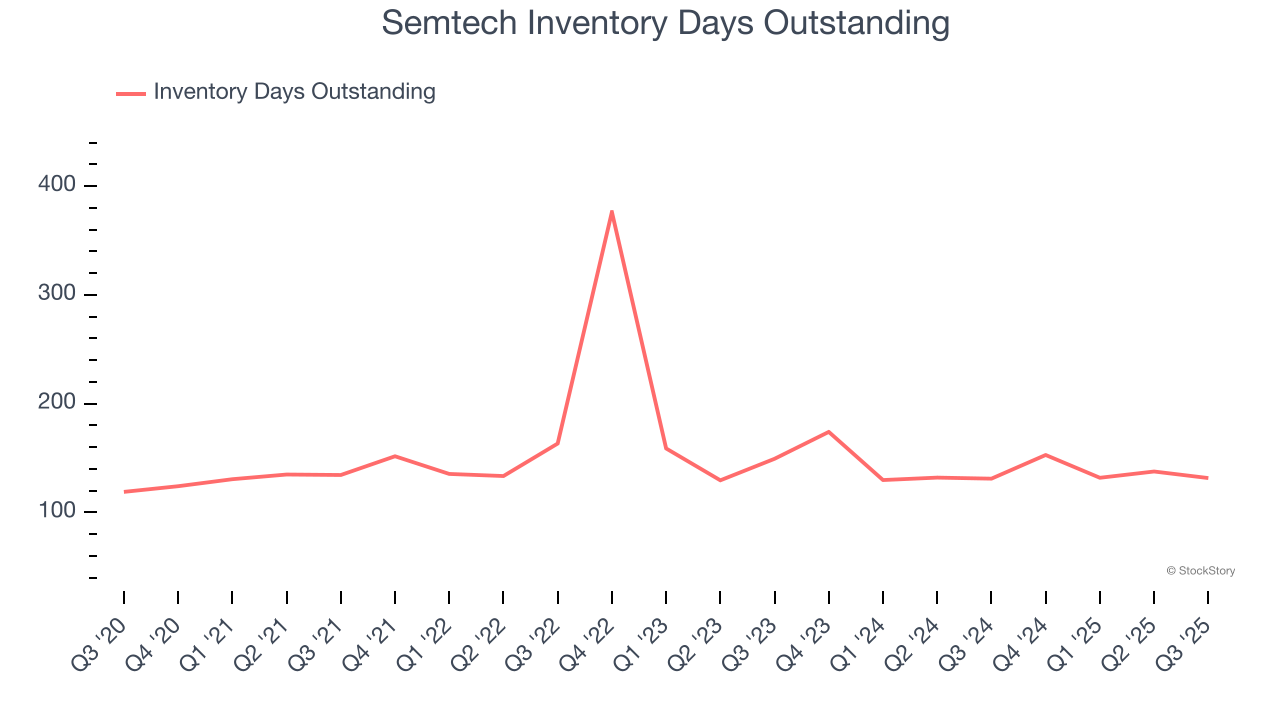
- Inventory Days Outstanding: 132, down from 138 in the previous quarter
- Market Capitalization: $5.54 billion
Company Overview
A public company since the late 1960s, Semtech (NASDAQ: SMTC) is a provider of analog and mixed-signal semiconductors used for Internet of Things systems and cloud connectivity.
Revenue Growth
A company’s long-term sales performance is one signal of its overall quality. Any business can experience short-term success, but top-performing ones enjoy sustained growth for years. Over the last five years, Semtech grew its sales at an impressive 12.6% compounded annual growth rate. Its growth beat the average semiconductor company and shows its offerings resonate with customers. Semiconductors are a cyclical industry, and long-term investors should be prepared for periods of high growth followed by periods of revenue contractions.
Long-term growth is the most important, but short-term results matter for semiconductors because the rapid pace of technological innovation (Moore's Law) could make yesterday's hit product obsolete today. Semtech’s annualized revenue growth of 10.3% over the last two years is below its five-year trend, but we still think the results suggest healthy demand. 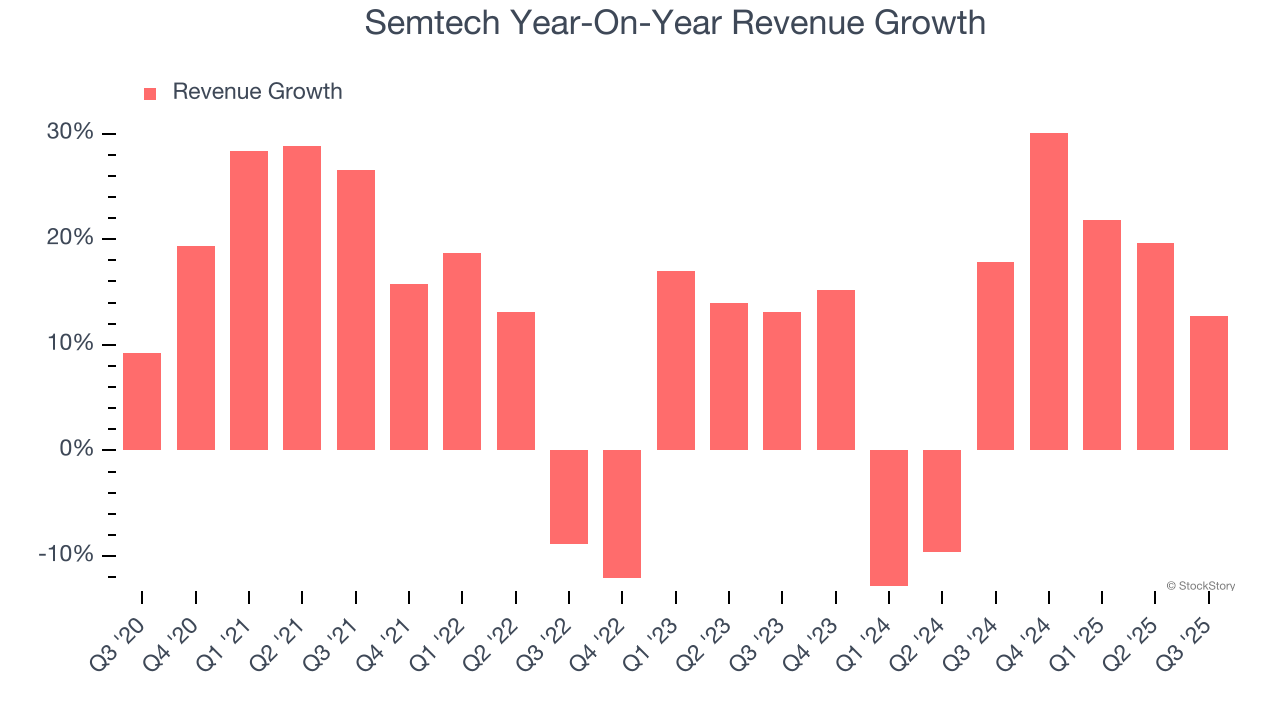
This quarter, Semtech’s year-on-year revenue growth was 12.8%, and its $267 million of revenue was in line with Wall Street’s estimates. Although the company met estimates, this was its third consecutive quarter of decelerating growth, potentially indicating a coming cyclical downturn. Company management is currently guiding for a 8.8% year-on-year increase in sales next quarter.
Looking further ahead, sell-side analysts expect revenue to grow 8.9% over the next 12 months, similar to its two-year rate. This projection doesn't excite us and indicates its products and services will see some demand headwinds.
Microsoft, Alphabet, Coca-Cola, Monster Beverage—all began as under-the-radar growth stories riding a massive trend. We’ve identified the next one: a profitable AI semiconductor play Wall Street is still overlooking. Go here for access to our full report.
Product Demand & Outstanding Inventory
Days Inventory Outstanding (DIO) is an important metric for chipmakers, as it reflects a business’ capital intensity and the cyclical nature of semiconductor supply and demand. In a tight supply environment, inventories tend to be stable, allowing chipmakers to exert pricing power. Steadily increasing DIO can be a warning sign that demand is weak, and if inventories continue to rise, the company may have to downsize production.
This quarter, Semtech’s DIO came in at 132, which is 21 days below its five-year average. At the moment, these numbers show no indication of an excessive inventory buildup.
Key Takeaways from Semtech’s Q3 Results
It was good to see Semtech beat analysts’ EPS expectations this quarter. We were also glad its adjusted operating income outperformed Wall Street’s estimates. Overall, we think this was a decent quarter with some key metrics above expectations. The market seemed to be hoping for more, and the stock traded down 4.1% to $67.24 immediately after reporting.
So do we think Semtech is an attractive buy at the current price? We think that the latest quarter is only one piece of the longer-term business quality puzzle. Quality, when combined with valuation, can help determine if the stock is a buy. We cover that in our actionable full research report which you can read here, it’s free for active Edge members.