Clothing company Kontoor Brands (NYSE: KTB) met Wall Streets revenue expectations in Q3 CY2025, with sales up 27.3% year on year to $853.2 million. The company’s outlook for the full year was close to analysts’ estimates with revenue guided to $3.11 billion at the midpoint. Its non-GAAP profit of $1.44 per share was 3.2% above analysts’ consensus estimates.
Is now the time to buy Kontoor Brands? Find out by accessing our full research report, it’s free for active Edge members.
Kontoor Brands (KTB) Q3 CY2025 Highlights:
- Revenue: $853.2 million vs analyst estimates of $857.1 million (27.3% year-on-year growth, in line)
- Adjusted EPS: $1.44 vs analyst estimates of $1.40 (3.2% beat)
- Adjusted EBITDA: $134.3 million vs analyst estimates of $125.4 million (15.7% margin, 7.1% beat)
- The company reconfirmed its revenue guidance for the full year of $3.11 billion at the midpoint
- Management slightly raised its full-year Adjusted EPS guidance to $5.50 at the midpoint
- Operating Margin: 7.5%, down from 14.7% in the same quarter last year
- Free Cash Flow Margin: 6.4%, down from 19.4% in the same quarter last year
- Constant Currency Revenue rose 27% year on year (2% in the same quarter last year)
- Market Capitalization: $4.50 billion
“Our third quarter results exceeded expectations driven by the strength of our expanded brand portfolio, gross margin expansion, and operational execution,” said Scott Baxter, President, Chief Executive Officer and Chairman of the Board of Directors.
Company Overview
Founded in 2019 after separating from VF Corporation, Kontoor Brands (NYSE: KTB) is a clothing company known for its high-quality denim products.
Revenue Growth
Examining a company’s long-term performance can provide clues about its quality. Any business can experience short-term success, but top-performing ones enjoy sustained growth for years. Unfortunately, Kontoor Brands’s 6.3% annualized revenue growth over the last five years was sluggish. This fell short of our benchmark for the consumer discretionary sector and is a poor baseline for our analysis.
Long-term growth is the most important, but within consumer discretionary, product cycles are short and revenue can be hit-driven due to rapidly changing trends and consumer preferences. Kontoor Brands’s recent performance shows its demand has slowed as its annualized revenue growth of 3% over the last two years was below its five-year trend. 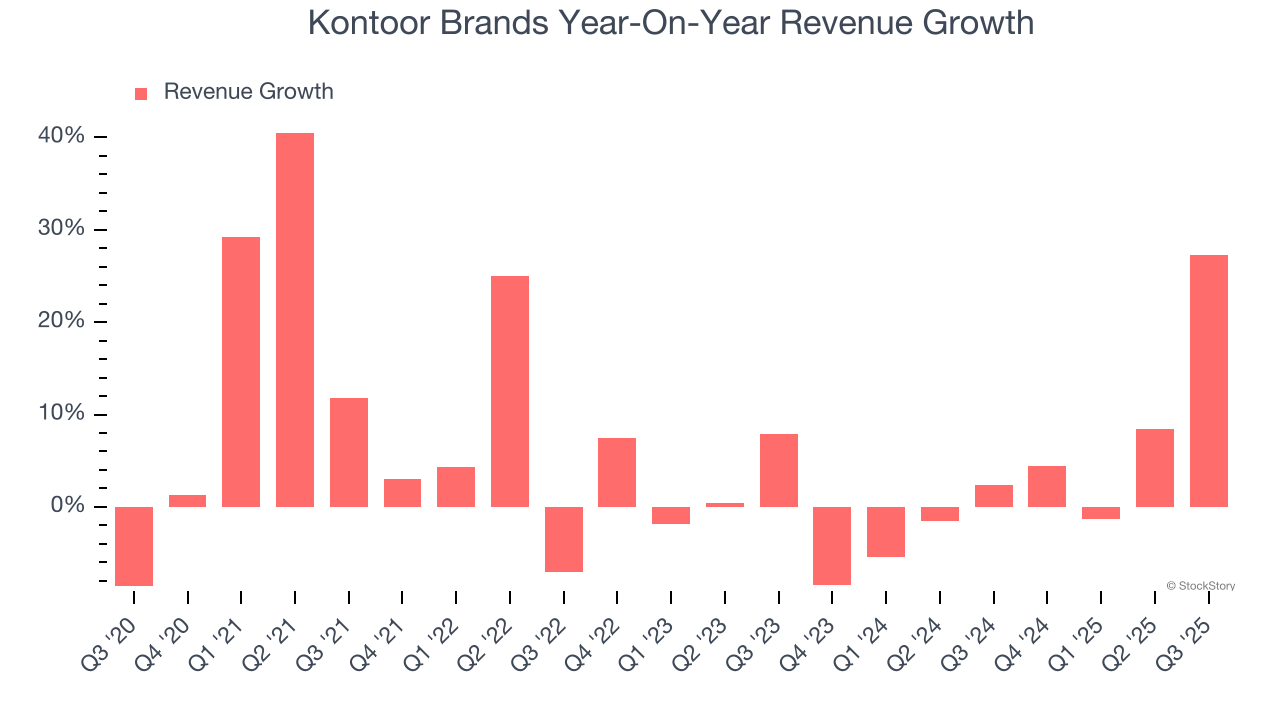
Kontoor Brands also reports sales performance excluding currency movements, which are outside the company’s control and not indicative of demand. Over the last two years, its constant currency sales averaged 3.1% year-on-year growth. Because this number aligns with its normal revenue growth, we can see that Kontoor Brands has properly hedged its foreign currency exposure. 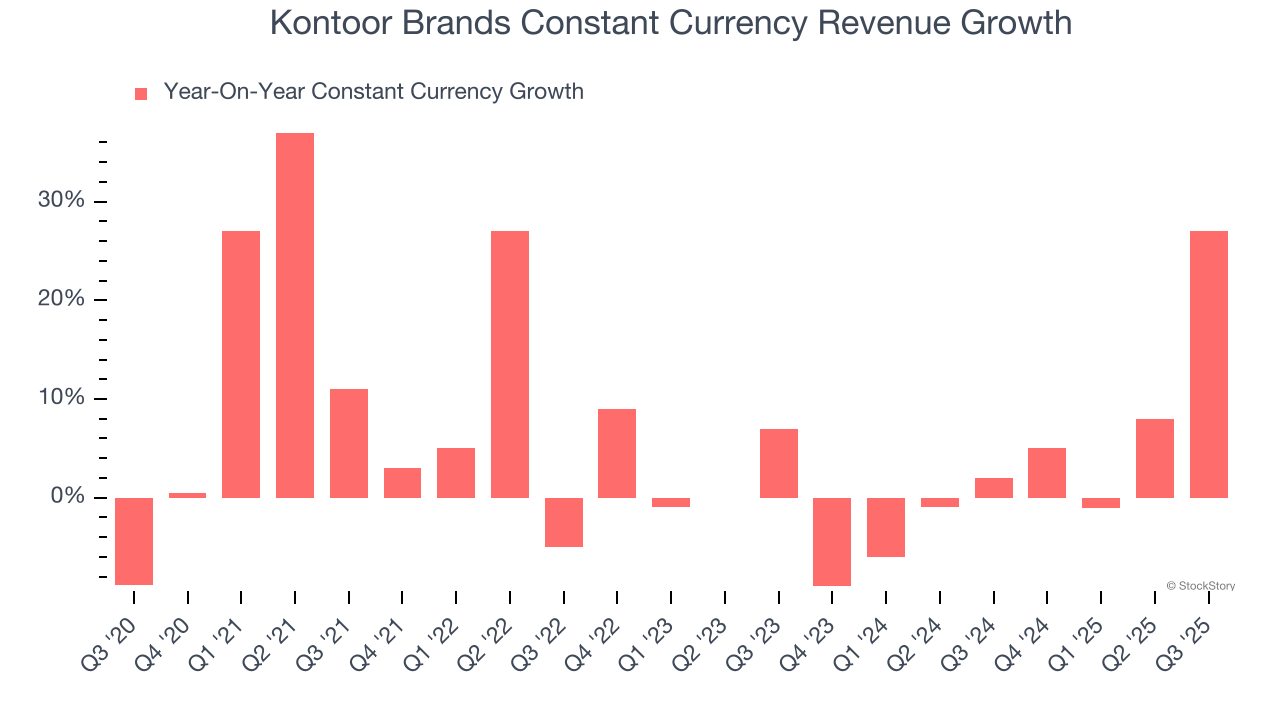
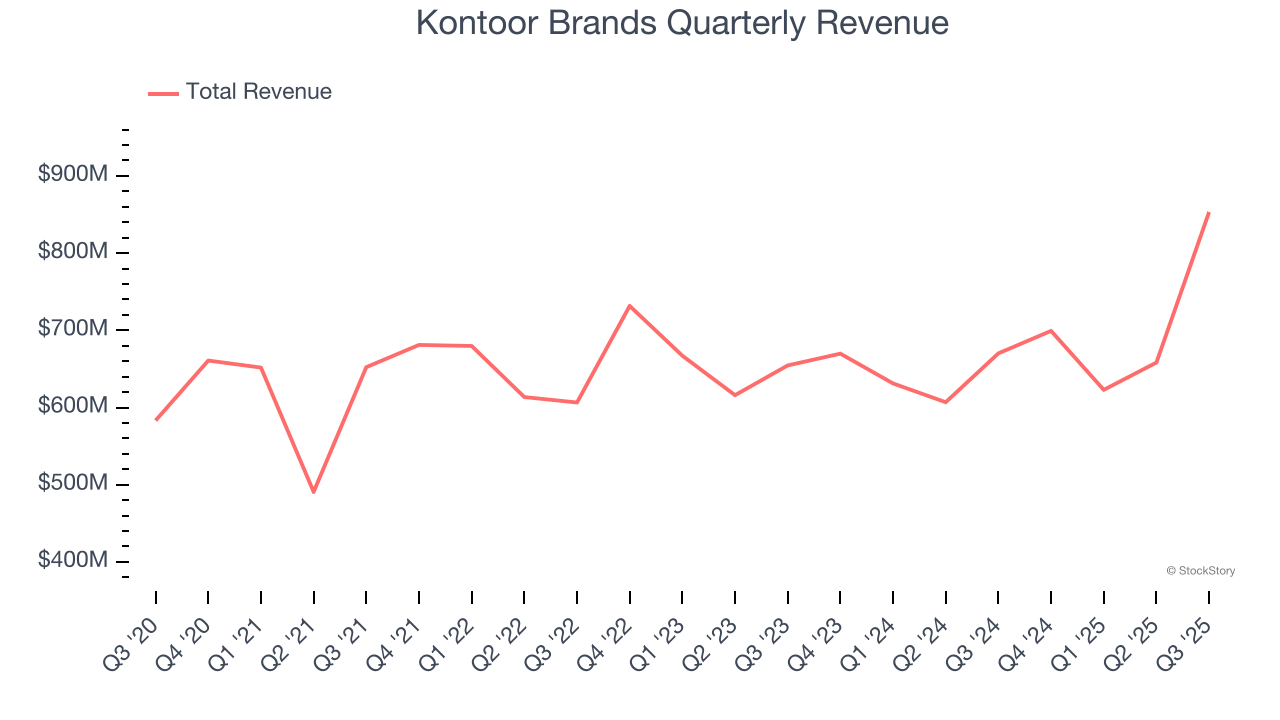
This quarter, Kontoor Brands’s year-on-year revenue growth of 27.3% was excellent, and its $853.2 million of revenue was in line with Wall Street’s estimates.
Looking ahead, sell-side analysts expect revenue to grow 21.2% over the next 12 months, an improvement versus the last two years. This projection is commendable and implies its newer products and services will spur better top-line performance.
The 1999 book Gorilla Game predicted Microsoft and Apple would dominate tech before it happened. Its thesis? Identify the platform winners early. Today, enterprise software companies embedding generative AI are becoming the new gorillas. a profitable, fast-growing enterprise software stock that is already riding the automation wave and looking to catch the generative AI next.
Operating Margin
Operating margin is a key measure of profitability. Think of it as net income - the bottom line - excluding the impact of taxes and interest on debt, which are less connected to business fundamentals.
Kontoor Brands’s operating margin has shrunk over the last 12 months, but it still averaged 11.7% over the last two years, decent for a consumer discretionary business. This shows it generally does a decent job managing its expenses.
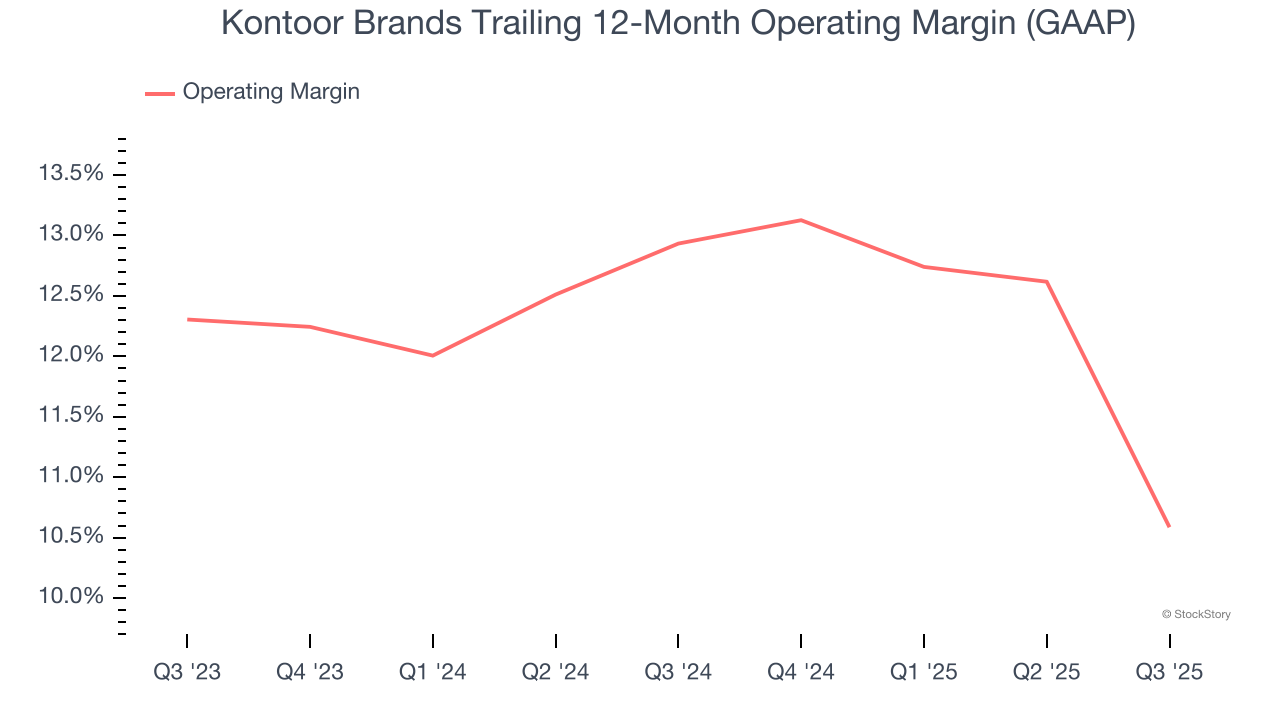
This quarter, Kontoor Brands generated an operating margin profit margin of 7.5%, down 7.2 percentage points year on year. This contraction shows it was less efficient because its expenses grew faster than its revenue.
Earnings Per Share
Revenue trends explain a company’s historical growth, but the long-term change in earnings per share (EPS) points to the profitability of that growth – for example, a company could inflate its sales through excessive spending on advertising and promotions.
Kontoor Brands’s EPS grew at a remarkable 17.4% compounded annual growth rate over the last five years, higher than its 6.3% annualized revenue growth. However, this alone doesn’t tell us much about its business quality because its operating margin didn’t improve.
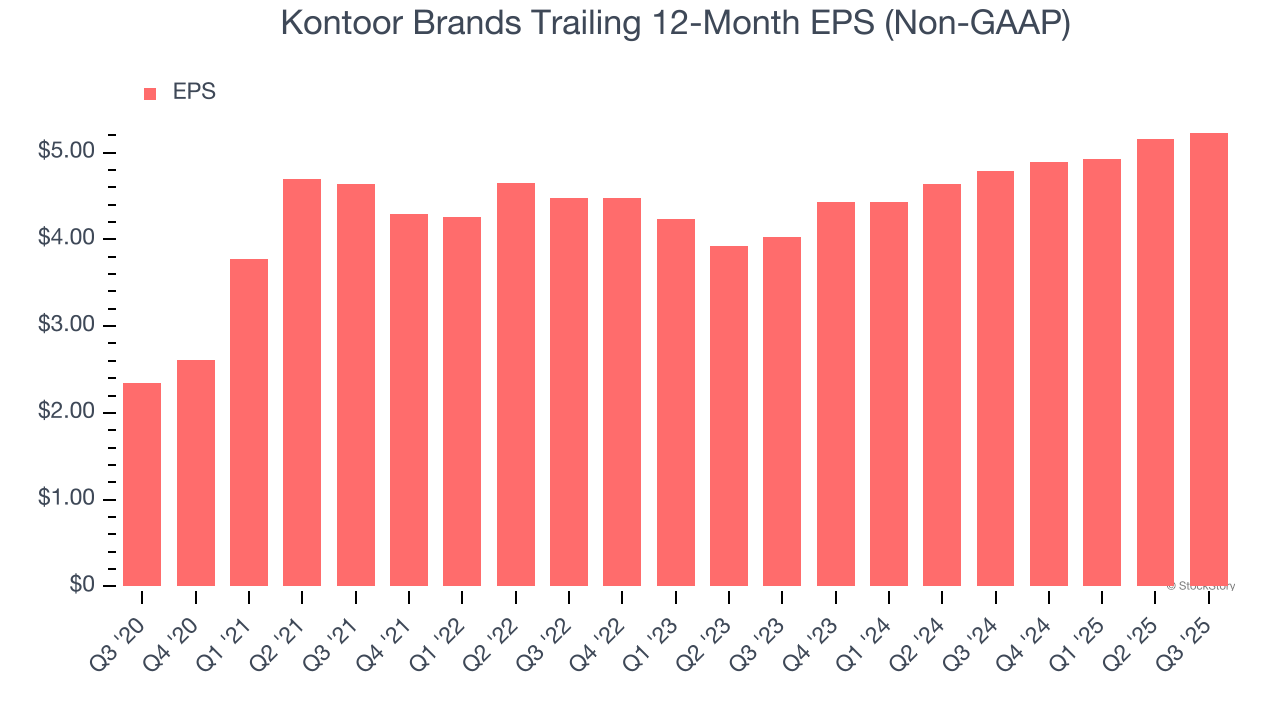
In Q3, Kontoor Brands reported adjusted EPS of $1.44, up from $1.37 in the same quarter last year. This print beat analysts’ estimates by 3.2%. Over the next 12 months, Wall Street expects Kontoor Brands’s full-year EPS of $5.23 to grow 11.2%.
Key Takeaways from Kontoor Brands’s Q3 Results
It was encouraging to see Kontoor Brands beat analysts’ EBITDA expectations this quarter. We were also glad its EPS outperformed Wall Street’s estimates. On the other hand, its constant currency revenue was in line and its revenue was in line with Wall Street’s estimates. Zooming out, we think this was a mixed quarter. The stock traded up 1.7% to $82.35 immediately following the results.
So do we think Kontoor Brands is an attractive buy at the current price? What happened in the latest quarter matters, but not as much as longer-term business quality and valuation, when deciding whether to invest in this stock. We cover that in our actionable full research report which you can read here, it’s free for active Edge members.