
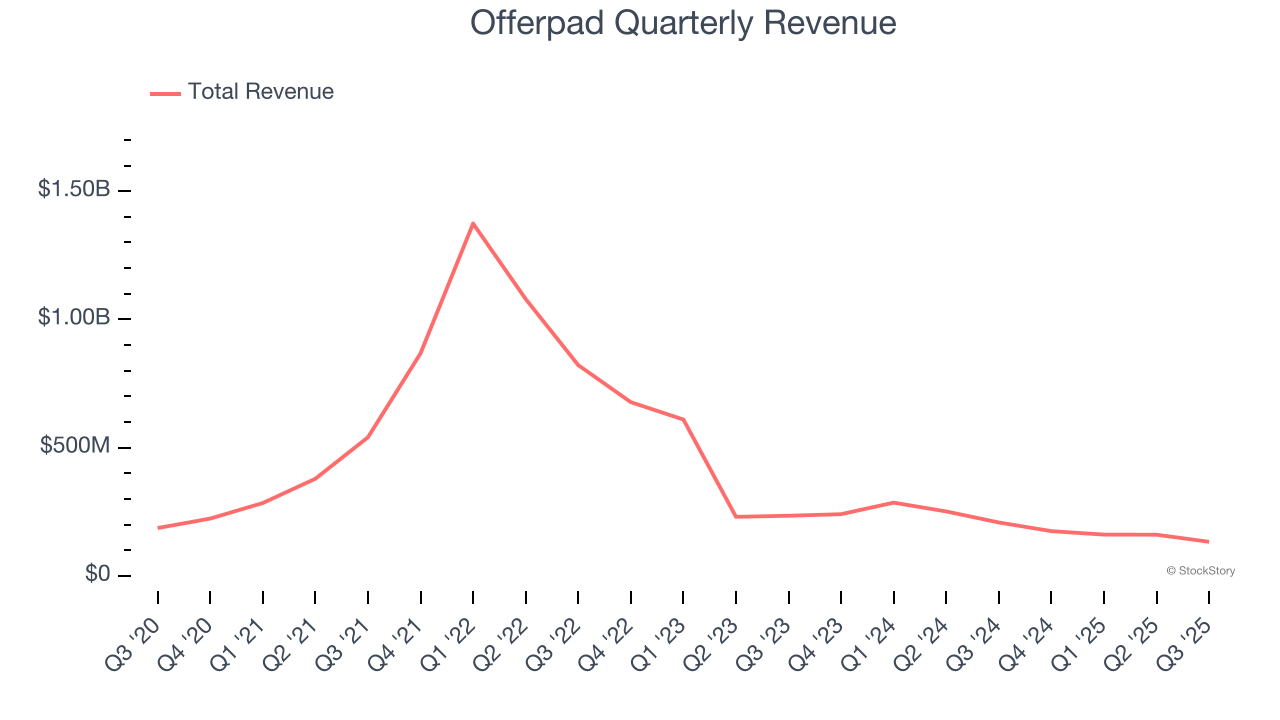
Technology real estate company Offerpad (NYSE: OPAD) missed Wall Street’s revenue expectations in Q3 CY2025, with sales falling 36.2% year on year to $132.7 million. Next quarter’s revenue guidance of $112.5 million underwhelmed, coming in 23.4% below analysts’ estimates. Its GAAP loss of $0.37 per share was 12.1% below analysts’ consensus estimates.
Is now the time to buy Offerpad? Find out by accessing our full research report, it’s free for active Edge members.
Offerpad (OPAD) Q3 CY2025 Highlights:
- Revenue: $132.7 million vs analyst estimates of $139.8 million (36.2% year-on-year decline, 5.1% miss)
- EPS (GAAP): -$0.37 vs analyst expectations of -$0.33 (12.1% miss)
- Adjusted EBITDA: -$4.57 million vs analyst estimates of -$2.63 million (-3.4% margin, 73.6% miss)
- Revenue Guidance for Q4 CY2025 is $112.5 million at the midpoint, below analyst estimates of $147 million
- Operating Margin: -5.1%, in line with the same quarter last year
- Free Cash Flow Margin: 30.1%, up from 18.6% in the same quarter last year
- Homes Sold: 367, down 248 year on year
- Market Capitalization: $85.38 million
“We’ve spent the past several quarters strengthening the foundation of our business and expanding our reach through asset-light services,” said Brian Bair, Chairman and CEO of Offerpad.
Company Overview
Known for giving homeowners cash offers within 24 hours, Offerpad (NYSE: OPAD) operates a tech-enabled platform specializing in direct home buying and selling solutions.
Revenue Growth
A company’s long-term sales performance can indicate its overall quality. Any business can put up a good quarter or two, but the best consistently grow over the long haul. Offerpad’s demand was weak over the last five years as its sales fell at a 11.6% annual rate. This was below our standards and is a sign of poor business quality.
We at StockStory place the most emphasis on long-term growth, but within consumer discretionary, a stretched historical view may miss a company riding a successful new product or trend. Offerpad’s recent performance shows its demand remained suppressed as its revenue has declined by 40.1% annually over the last two years. 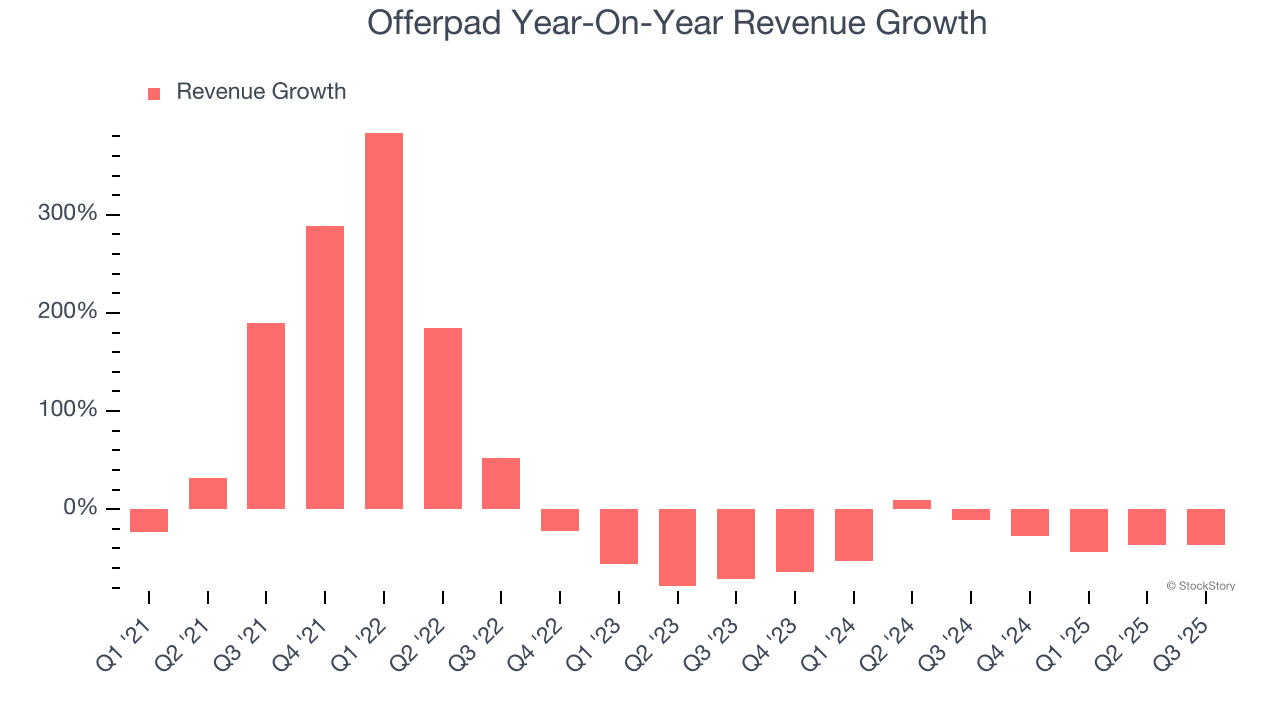
We can better understand the company’s revenue dynamics by analyzing its number of homes sold and homes purchased, which clocked in at 367 and 203 in the latest quarter. Over the last two years, Offerpad’s homes sold averaged 32.7% year-on-year declines while its homes purchased averaged 11.8% year-on-year declines. 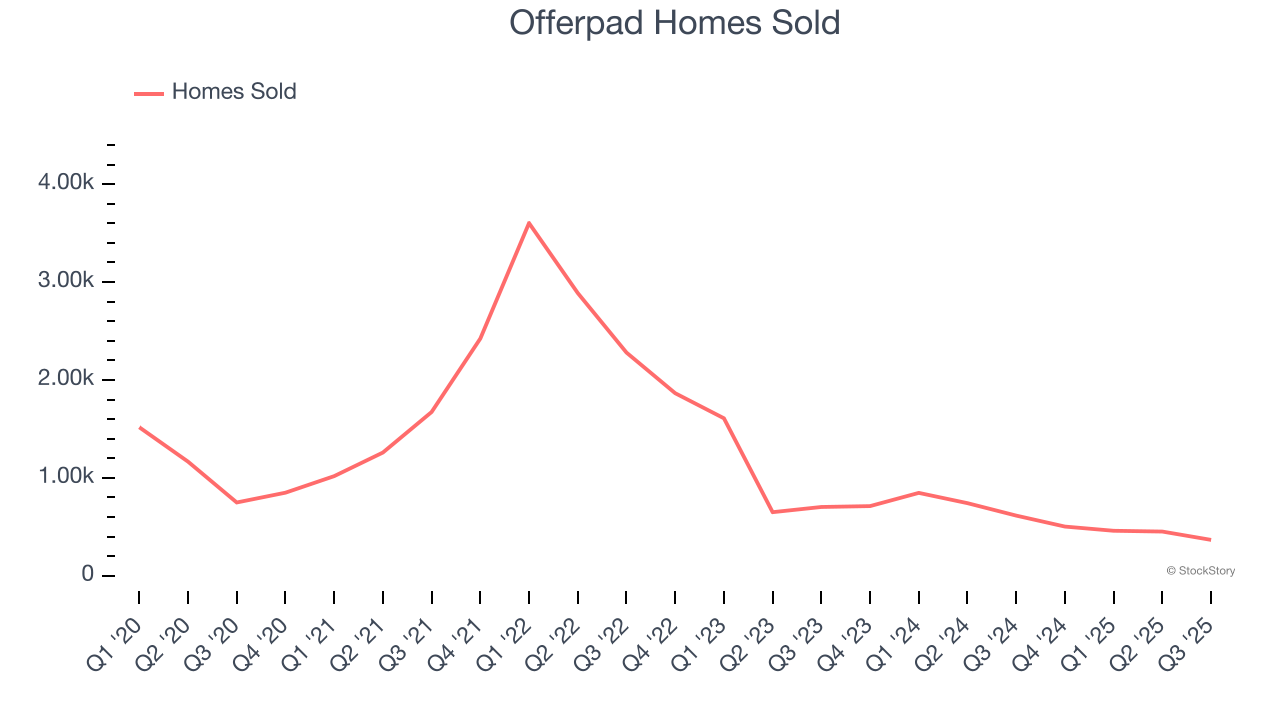
This quarter, Offerpad missed Wall Street’s estimates and reported a rather uninspiring 36.2% year-on-year revenue decline, generating $132.7 million of revenue. Company management is currently guiding for a 35.4% year-on-year decline in sales next quarter.
Looking further ahead, sell-side analysts expect revenue to grow 8.7% over the next 12 months. Although this projection indicates its newer products and services will fuel better top-line performance, it is still below average for the sector.
Software is eating the world and there is virtually no industry left that has been untouched by it. That drives increasing demand for tools helping software developers do their jobs, whether it be monitoring critical cloud infrastructure, integrating audio and video functionality, or ensuring smooth content streaming. Click here to access a free report on our 3 favorite stocks to play this generational megatrend.
Operating Margin
Operating margin is a key measure of profitability. Think of it as net income - the bottom line - excluding the impact of taxes and interest on debt, which are less connected to business fundamentals.
Offerpad’s operating margin has been trending down over the last 12 months and averaged negative 5.2% over the last two years. Unprofitable consumer discretionary companies with falling margins deserve extra scrutiny because they’re spending loads of money to stay relevant, an unsustainable practice.
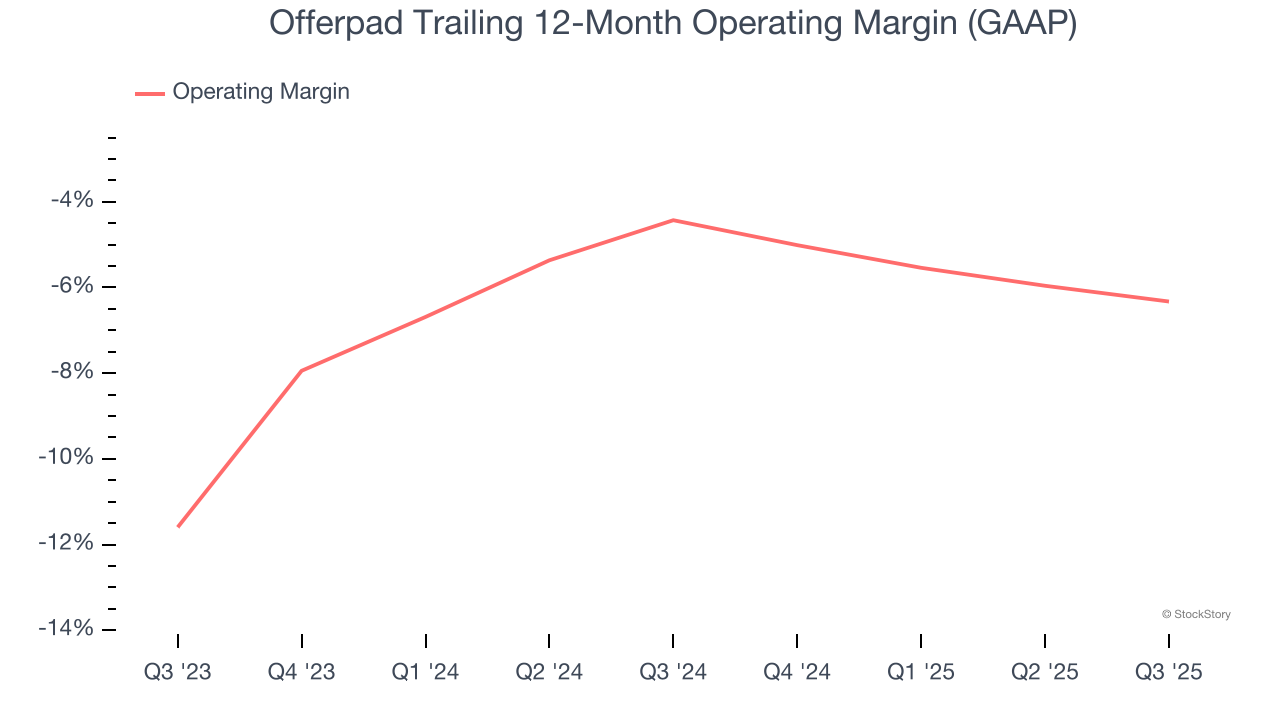
This quarter, Offerpad generated a negative 5.1% operating margin. The company's consistent lack of profits raise a flag.
Earnings Per Share
We track the long-term change in earnings per share (EPS) for the same reason as long-term revenue growth. Compared to revenue, however, EPS highlights whether a company’s growth is profitable.
Although Offerpad’s full-year earnings are still negative, it reduced its losses and improved its EPS by 48.9% annually over the last five years. The next few quarters will be critical for assessing its long-term profitability.
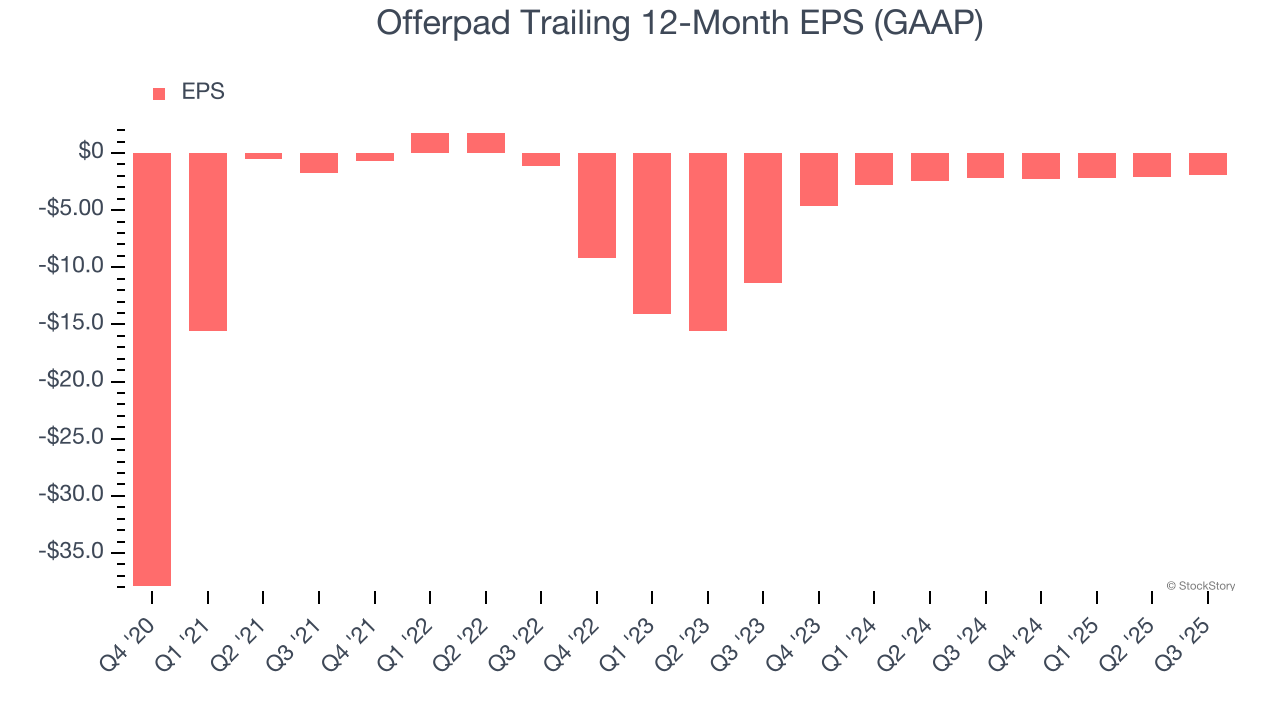
In Q3, Offerpad reported EPS of negative $0.37, up from negative $0.49 in the same quarter last year. Despite growing year on year, this print missed analysts’ estimates. Over the next 12 months, Wall Street expects Offerpad to improve its earnings losses. Analysts forecast its full-year EPS of negative $1.94 will advance to negative $0.89.
Key Takeaways from Offerpad’s Q3 Results
We struggled to find many positives in these results. Its number of homes purchased missed and its number of homes sold fell short of Wall Street’s estimates. Overall, this was a weaker quarter. The stock traded down 9.5% to $2.10 immediately after reporting.
Offerpad’s earnings report left more to be desired. Let’s look forward to see if this quarter has created an opportunity to buy the stock. When making that decision, it’s important to consider its valuation, business qualities, as well as what has happened in the latest quarter. We cover that in our actionable full research report which you can read here, it’s free for active Edge members.


