
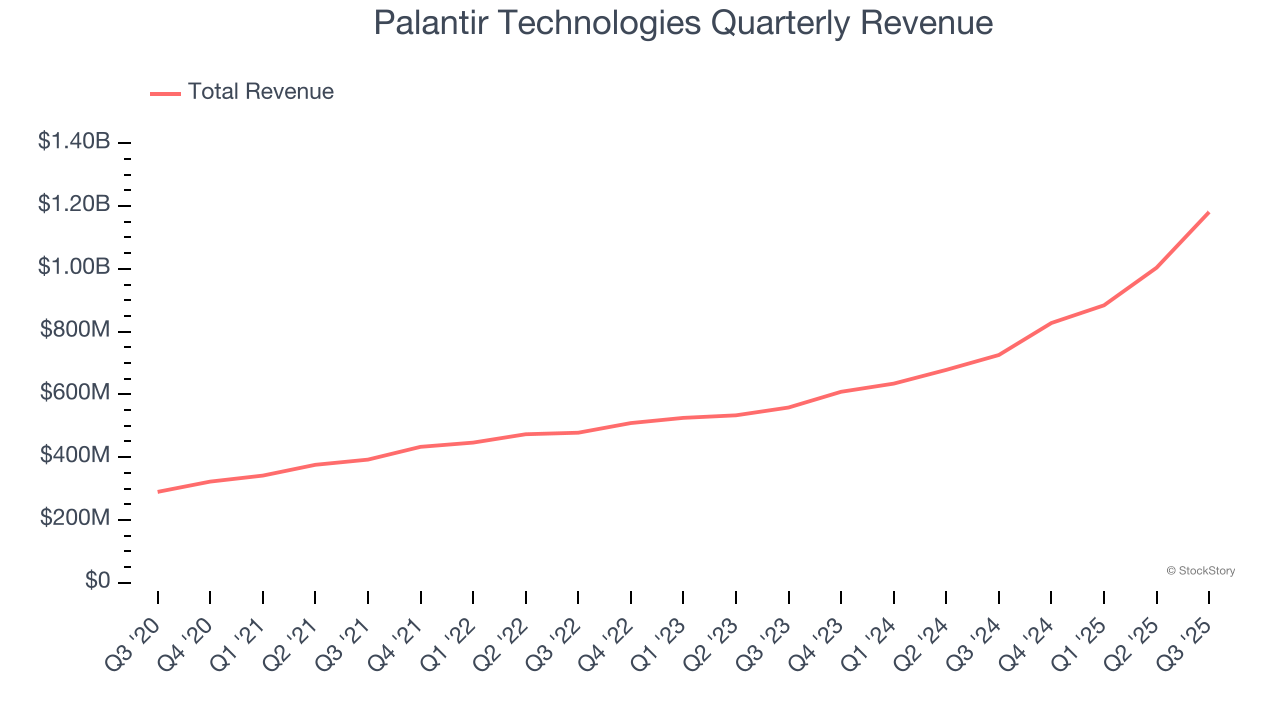
Data analytics company Palantir Technologies (NASDAQ: PLTR) reported revenue ahead of Wall Streets expectations in Q3 CY2025, with sales up 62.8% year on year to $1.18 billion. On top of that, next quarter’s revenue guidance ($1.33 billion at the midpoint) was surprisingly good and 11.2% above what analysts were expecting. Its non-GAAP profit of $0.21 per share was 25.5% above analysts’ consensus estimates.
Is now the time to buy Palantir Technologies? Find out by accessing our full research report, it’s free for active Edge members.
Palantir Technologies (PLTR) Q3 CY2025 Highlights:
- Revenue: $1.18 billion vs analyst estimates of $1.09 billion (62.8% year-on-year growth, 8% beat)
- Adjusted EPS: $0.21 vs analyst estimates of $0.17 (25.5% beat)
- Adjusted Operating Income: $600.5 million vs analyst estimates of $501.9 million (50.8% margin, 19.7% beat)
- Revenue Guidance for Q4 CY2025 is $1.33 billion at the midpoint, above analyst estimates of $1.20 billion
- Operating Margin: 33.3%, up from 15.6% in the same quarter last year
- Free Cash Flow Margin: 45.7%, down from 56.7% in the previous quarter
- Market Capitalization: $475.6 billion
“114% - our Rule of 40 score! These results make undeniable the transformational impact of using AIP to compound AI leverage. Year-over-year growth in our U.S. business surged to 77%, and year-over-year growth in U.S. commercial climbed to 121%. We are yet again announcing the highest sequential quarterly revenue growth guide in our company’s history, representing 61% year-over-year growth,” said Alex C. Karp, Co-Founder and Chief Executive Officer of Palantir Technologies.
Company Overview
Named after the all-seeing stones in "Lord of the Rings," Palantir Technologies (NASDAQ: PLTR) develops software platforms that help government agencies and enterprises integrate, analyze, and operationalize their data for decision-making.
Revenue Growth
Examining a company’s long-term performance can provide clues about its quality. Any business can have short-term success, but a top-tier one grows for years. Luckily, Palantir Technologies’s sales grew at an excellent 31.3% compounded annual growth rate over the last five years. Its growth surpassed the average software company and shows its offerings resonate with customers, a great starting point for our analysis.
We at StockStory place the most emphasis on long-term growth, but within software, a half-decade historical view may miss recent innovations or disruptive industry trends. Palantir Technologies’s annualized revenue growth of 35.4% over the last two years is above its five-year trend, suggesting its demand was strong and recently accelerated. 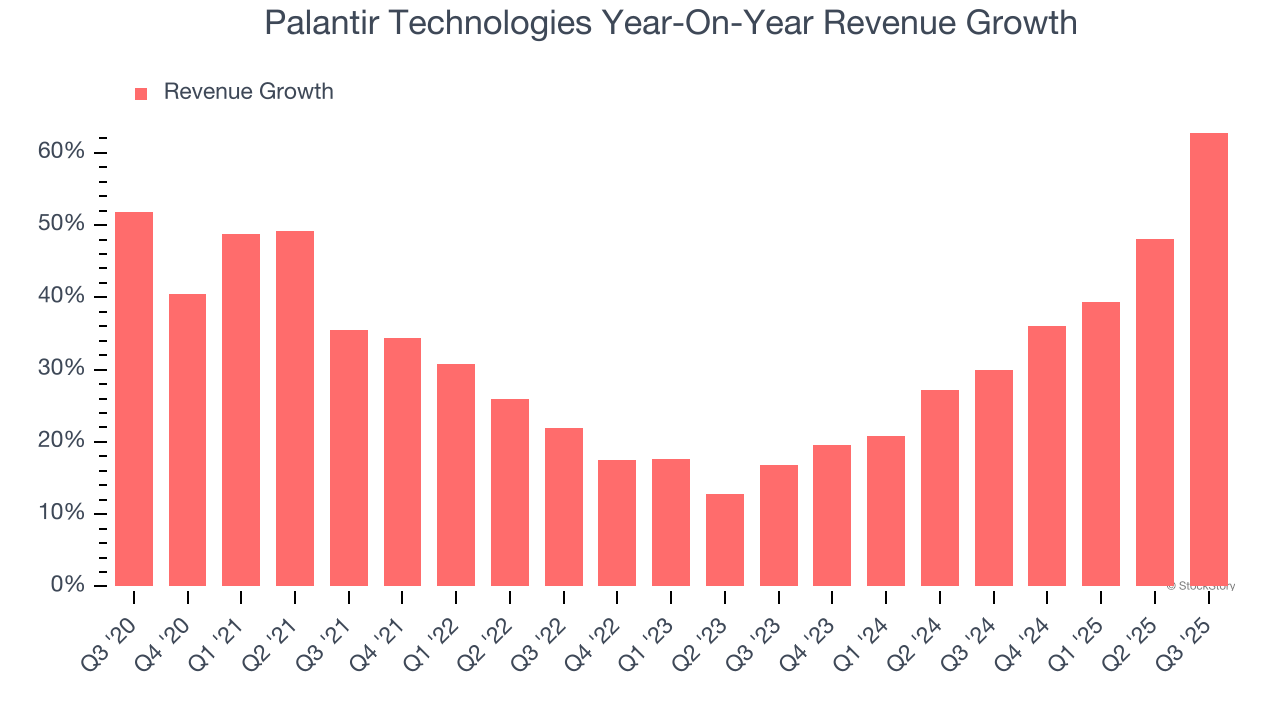
This quarter, Palantir Technologies reported magnificent year-on-year revenue growth of 62.8%, and its $1.18 billion of revenue beat Wall Street’s estimates by 8%. Company management is currently guiding for a 60.6% year-on-year increase in sales next quarter.
Looking further ahead, sell-side analysts expect revenue to grow 35.4% over the next 12 months, similar to its two-year rate. This projection is eye-popping and indicates the market is baking in success for its products and services.
While Wall Street chases Nvidia at all-time highs, an under-the-radar semiconductor supplier is dominating a critical AI component these giants can’t build without. Click here to access our free report one of our favorites growth stories.
Customer Acquisition Efficiency
The customer acquisition cost (CAC) payback period measures the months a company needs to recoup the money spent on acquiring a new customer. This metric helps assess how quickly a business can break even on its sales and marketing investments.
Palantir Technologies is extremely efficient at acquiring new customers, and its CAC payback period checked in at 9.8 months this quarter. The company’s rapid recovery of its customer acquisition costs indicates it has a highly differentiated product offering and a strong brand reputation. These dynamics give Palantir Technologies more resources to pursue new product initiatives while maintaining the flexibility to increase its sales and marketing investments.
Key Takeaways from Palantir Technologies’s Q3 Results
We were impressed by how significantly Palantir Technologies blew past analysts’ EBITDA expectations this quarter. We were also glad its revenue guidance for next quarter trumped Wall Street’s estimates. Zooming out, we think this was a good print with some key areas of upside. The stock remained flat at $206.80 immediately after reporting.
Big picture, is Palantir Technologies a buy here and now? What happened in the latest quarter matters, but not as much as longer-term business quality and valuation, when deciding whether to invest in this stock. We cover that in our actionable full research report which you can read here, it’s free for active Edge members.


