Digital casino game platform PlayStudios (NASDAQ: MYPS) missed Wall Street’s revenue expectations in Q3 CY2025, with sales falling 19.1% year on year to $57.65 million. Its GAAP loss of $0.07 per share was significantly below analysts’ consensus estimates.
Is now the time to buy PlayStudios? Find out by accessing our full research report, it’s free for active Edge members.
PlayStudios (MYPS) Q3 CY2025 Highlights:
- Revenue: $57.65 million vs analyst estimates of $59.45 million (19.1% year-on-year decline, 3% miss)
- EPS (GAAP): -$0.07 vs analyst estimates of -$0.02 (significant miss)
- Adjusted EBITDA: $7.25 million vs analyst estimates of $10.06 million (12.6% margin, 28% miss)
- Operating Margin: -13.6%, down from -6.7% in the same quarter last year
- Daily Active Users: 2.21 million, down 750,000 year on year
- Market Capitalization: $116.6 million
Company Overview
Founded by a team of former gaming industry executives, PlayStudios (NASDAQ: MYPS) offers free-to-play digital casino games.
Revenue Growth
A company’s long-term sales performance is one signal of its overall quality. Any business can put up a good quarter or two, but many enduring ones grow for years. PlayStudios struggled to consistently generate demand over the last five years as its sales dropped at a 1.2% annual rate. This was below our standards and suggests it’s a low quality business.
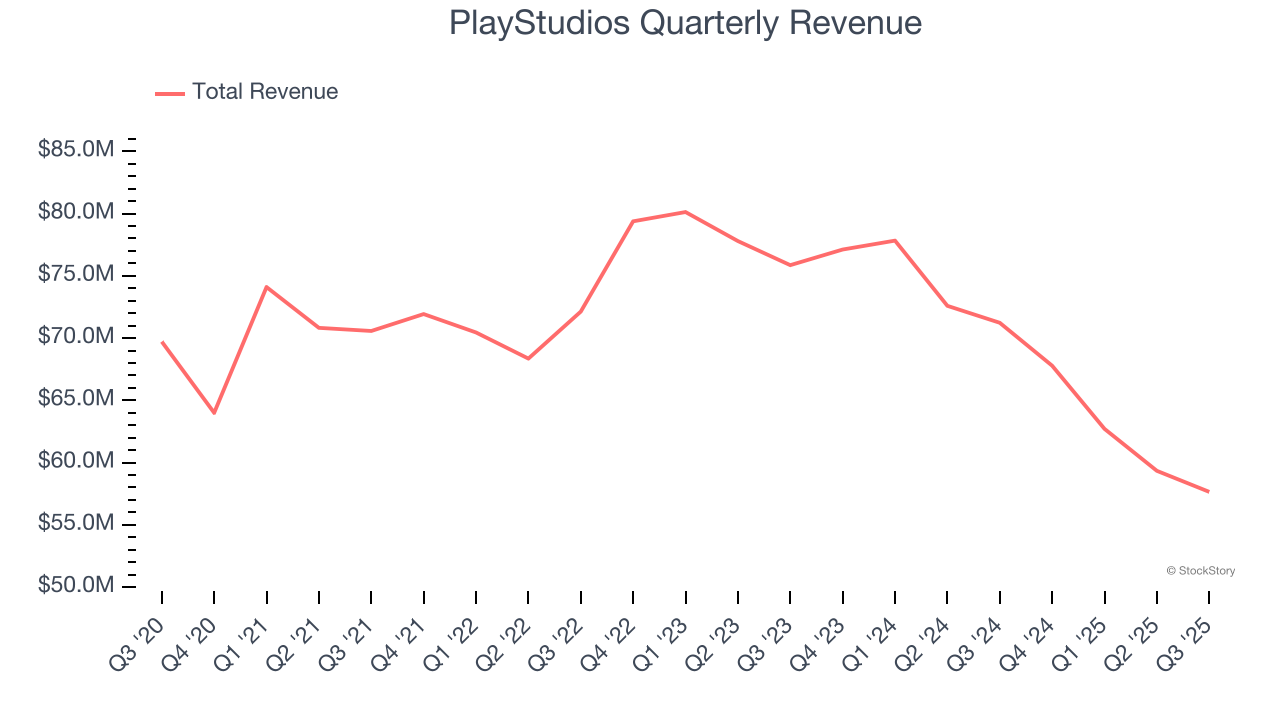
We at StockStory place the most emphasis on long-term growth, but within consumer discretionary, a stretched historical view may miss a company riding a successful new product or trend. PlayStudios’s recent performance shows its demand remained suppressed as its revenue has declined by 11.1% annually over the last two years. 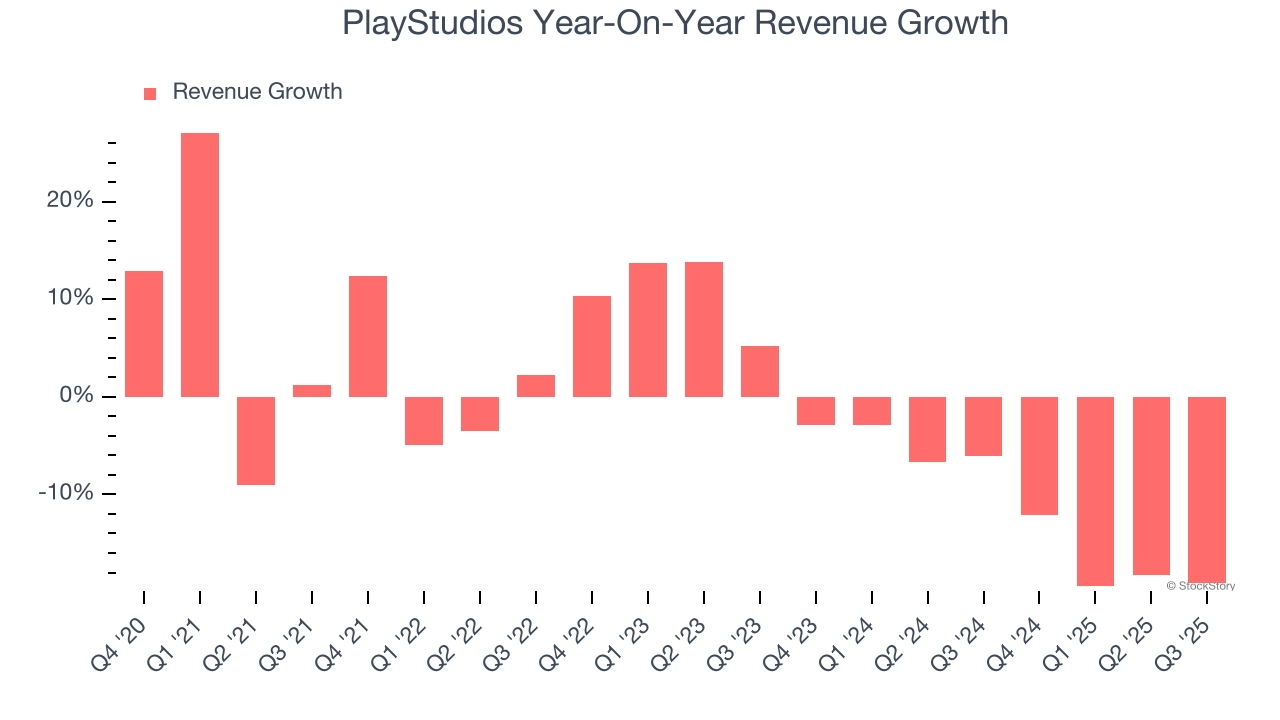
This quarter, PlayStudios missed Wall Street’s estimates and reported a rather uninspiring 19.1% year-on-year revenue decline, generating $57.65 million of revenue.
Looking ahead, sell-side analysts expect revenue to grow 2.1% over the next 12 months. While this projection indicates its newer products and services will catalyze better top-line performance, it is still below average for the sector.
Software is eating the world and there is virtually no industry left that has been untouched by it. That drives increasing demand for tools helping software developers do their jobs, whether it be monitoring critical cloud infrastructure, integrating audio and video functionality, or ensuring smooth content streaming. Click here to access a free report on our 3 favorite stocks to play this generational megatrend.
Operating Margin
PlayStudios’s operating margin has been trending down over the last 12 months and averaged negative 9.1% over the last two years. Unprofitable consumer discretionary companies with falling margins deserve extra scrutiny because they’re spending loads of money to stay relevant, an unsustainable practice.
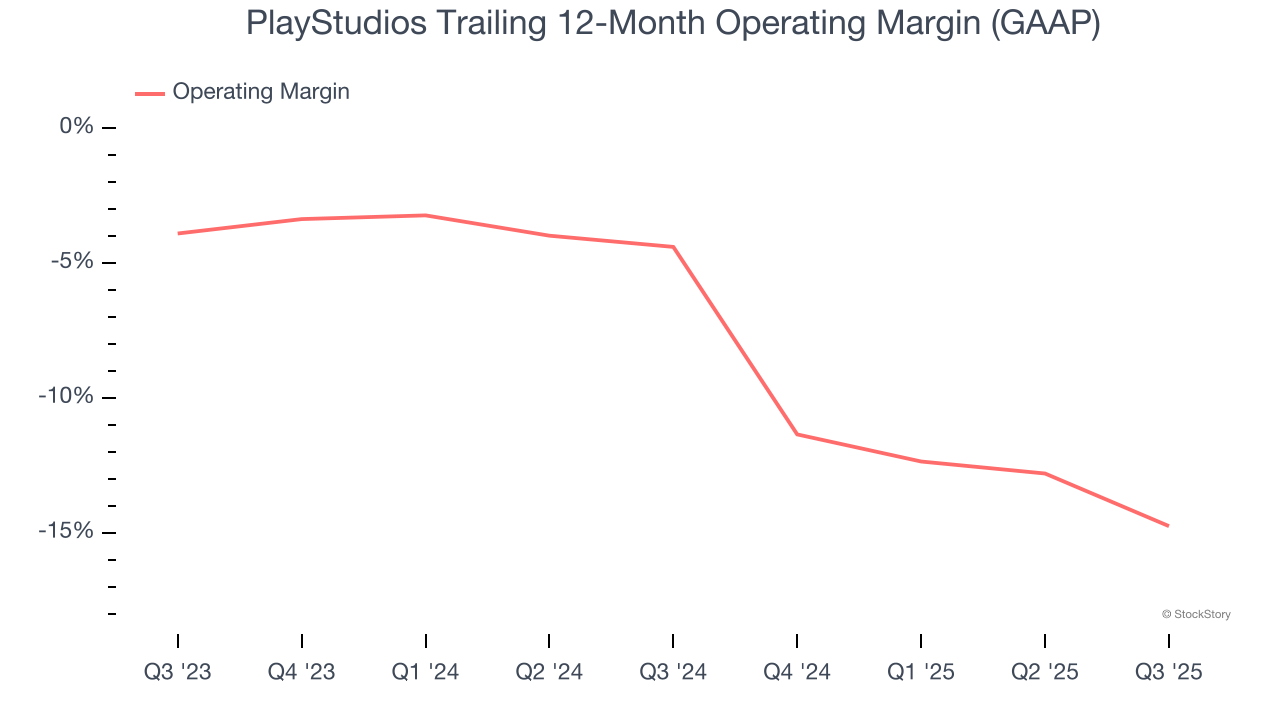
PlayStudios’s operating margin was negative 13.6% this quarter. The company's consistent lack of profits raise a flag.
Earnings Per Share
We track the long-term change in earnings per share (EPS) for the same reason as long-term revenue growth. Compared to revenue, however, EPS highlights whether a company’s growth is profitable.
Sadly for PlayStudios, its EPS declined by 26.2% annually over the last five years, more than its revenue. This tells us the company struggled because its fixed cost base made it difficult to adjust to shrinking demand.
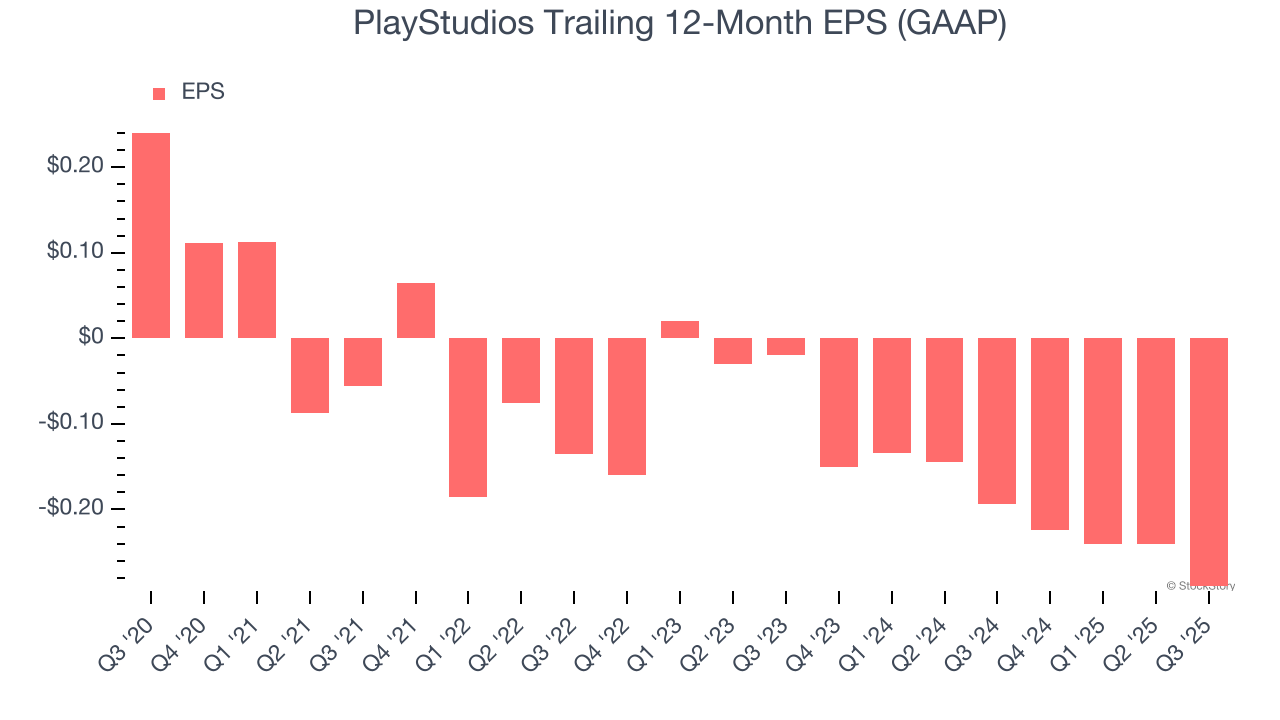
In Q3, PlayStudios reported EPS of negative $0.07, down from negative $0.02 in the same quarter last year. This print missed analysts’ estimates. Over the next 12 months, Wall Street expects PlayStudios to improve its earnings losses. Analysts forecast its full-year EPS of negative $0.29 will advance to negative $0.06.
Key Takeaways from PlayStudios’s Q3 Results
We struggled to find many positives in these results. Its EBITDA missed and its EPS fell short of Wall Street’s estimates. Overall, this was a weaker quarter. The stock traded down 14.6% to $0.77 immediately after reporting.
PlayStudios underperformed this quarter, but does that create an opportunity to invest right now? We think that the latest quarter is only one piece of the longer-term business quality puzzle. Quality, when combined with valuation, can help determine if the stock is a buy. We cover that in our actionable full research report which you can read here, it’s free for active Edge members.