
Hartford currently trades at $124.27 per share and has shown little upside over the past six months, posting a small loss of 1.1%. The stock also fell short of the S&P 500’s 21.3% gain during that period.
Is now the time to buy HIG? Find out in our full research report, it’s free for active Edge members.
Why Does Hartford Spark Debate?
Recognizable by its iconic stag logo that dates back to 1810, The Hartford (NYSE: HIG) provides property and casualty insurance, group benefits, and investment products to individuals and businesses across the United States.
Two Positive Attributes:
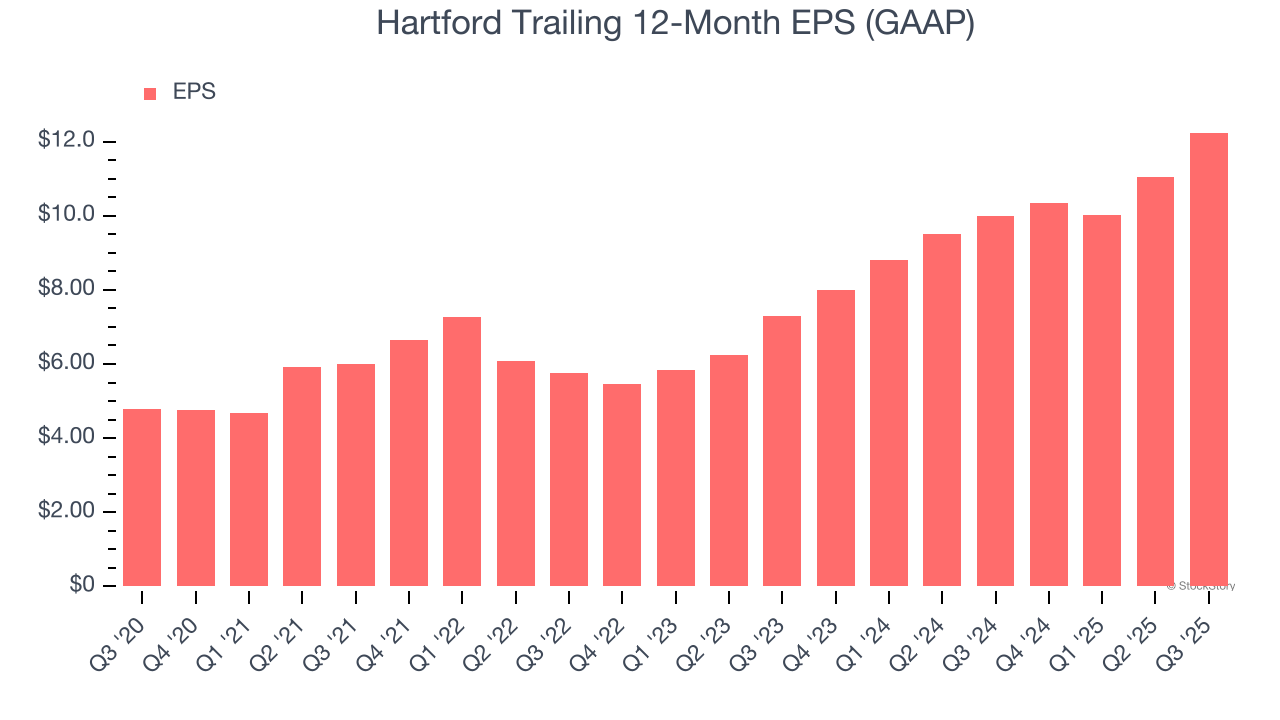
1. Outstanding Long-Term EPS Growth
We track the long-term change in earnings per share (EPS) because it highlights whether a company’s growth is profitable.
Hartford’s EPS grew at a spectacular 20.7% compounded annual growth rate over the last five years, higher than its 6.3% annualized revenue growth. This tells us the company became more profitable on a per-share basis as it expanded.
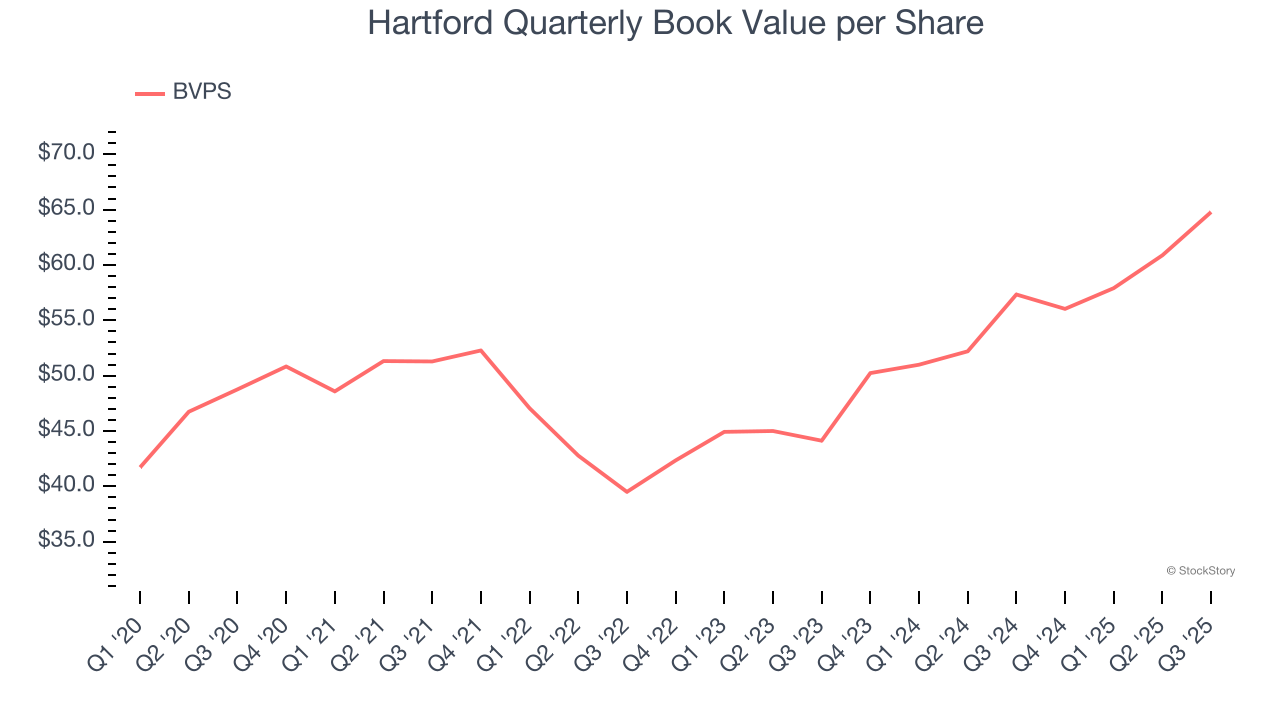
2. Projected BVPS Growth Is Remarkable
The key to book value per share (BVPS) growth is an insurer’s ability to earn underwriting profits while generating strong returns on its float - Warren Buffet’s secret sauce.
Over the next 12 months, Consensus estimates call for Hartford’s BVPS to grow by 21.2% to $70.42, elite growth rate.
One Reason to be Careful:
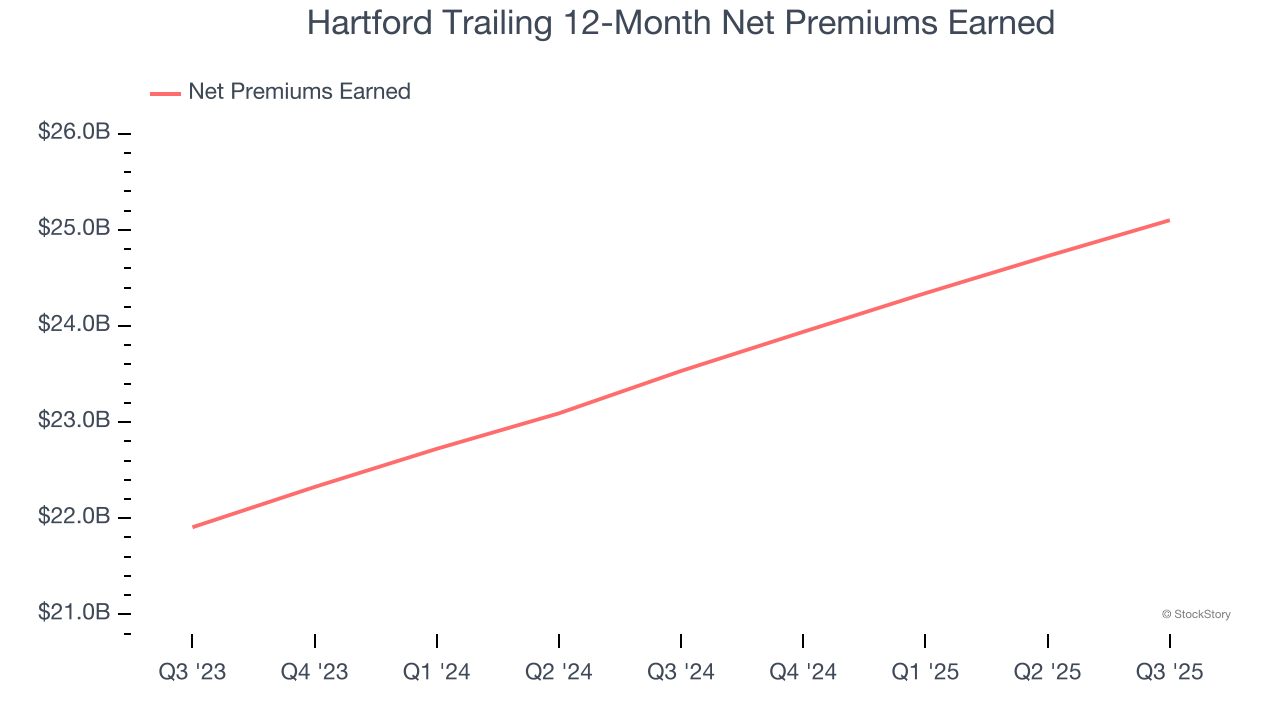
Net Premiums Earned Point to Soft Demand
When insurers sell policies, they protect themselves from extremely large losses or an outsized accumulation of losses with reinsurance (insurance for insurance companies). Net premiums earned are therefore gross premiums less what’s ceded to reinsurers as a risk mitigation and transfer strategy.
Hartford’s net premiums earned has grown at a 6.4% annualized rate over the last five years, slightly worse than the broader insurance industry and in line with its total revenue.
Final Judgment
Hartford’s merits more than compensate for its flaws. With its shares underperforming the market lately, the stock trades at $124.27 per share (or a forward price-to-sales ratio of 1.2×). Is now a good time to buy? See for yourself in our in-depth research report, it’s free for active Edge members.
High-Quality Stocks for All Market Conditions
Donald Trump’s April 2025 "Liberation Day" tariffs sent markets into a tailspin, but stocks have since rebounded strongly, proving that knee-jerk reactions often create the best buying opportunities.
The smart money is already positioning for the next leg up. Don’t miss out on the recovery - check out our Top 5 Growth Stocks for this month. This is a curated list of our High Quality stocks that have generated a market-beating return of 183% over the last five years (as of March 31st 2025).
Stocks that made our list in 2020 include now familiar names such as Nvidia (+1,545% between March 2020 and March 2025) as well as under-the-radar businesses like the once-small-cap company Exlservice (+354% five-year return). Find your next big winner with StockStory today.
StockStory is growing and hiring equity analyst and marketing roles. Are you a 0 to 1 builder passionate about the markets and AI? See the open roles here.


