
Self defense company AXON (NASDAQ: AXON) reported revenue ahead of Wall Streets expectations in Q3 CY2025, with sales up 30.6% year on year to $710.6 million. Guidance for next quarter’s revenue was better than expected at $752.5 million at the midpoint, 1.3% above analysts’ estimates. Its non-GAAP profit of $1.17 per share was 24.1% below analysts’ consensus estimates.
Is now the time to buy Axon? Find out by accessing our full research report, it’s free for active Edge members.
Axon (AXON) Q3 CY2025 Highlights:
- Revenue: $710.6 million vs analyst estimates of $705.2 million (30.6% year-on-year growth, 0.8% beat)
- Adjusted EPS: $1.17 vs analyst expectations of $1.54 (24.1% miss)
- Adjusted EBITDA: $177 million vs analyst estimates of $173 million (24.9% margin, 2.3% beat)
- Revenue Guidance for Q4 CY2025 is $752.5 million at the midpoint, above analyst estimates of $743 million
- EBITDA guidance for Q4 CY2025 is $180 million at the midpoint, below analyst estimates of $187.5 million
- Operating Margin: -0.3%, down from 4.4% in the same quarter last year
- Free Cash Flow Margin: 4.7%, down from 12.5% in the same quarter last year
- Market Capitalization: $56.85 billion
Company Overview
Providing body cameras and tasers for first responders, AXON (NASDAQ: AXON) develops technology solutions and weapons products for military, law enforcement, and civilians.
Revenue Growth
A company’s long-term sales performance can indicate its overall quality. Even a bad business can shine for one or two quarters, but a top-tier one grows for years. Thankfully, Axon’s 32.5% annualized revenue growth over the last five years was incredible. Its growth surpassed the average industrials company and shows its offerings resonate with customers, a great starting point for our analysis.
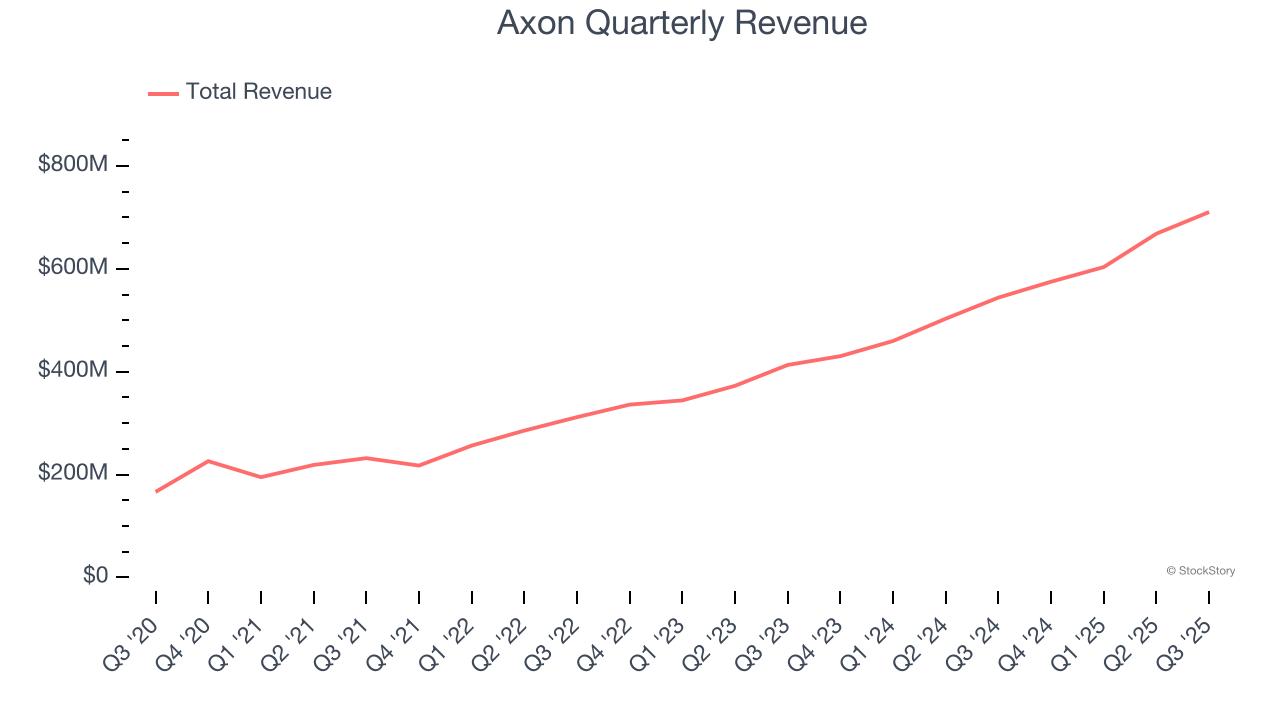
Long-term growth is the most important, but within industrials, a half-decade historical view may miss new industry trends or demand cycles. Axon’s annualized revenue growth of 32.1% over the last two years aligns with its five-year trend, suggesting its demand was predictably strong. 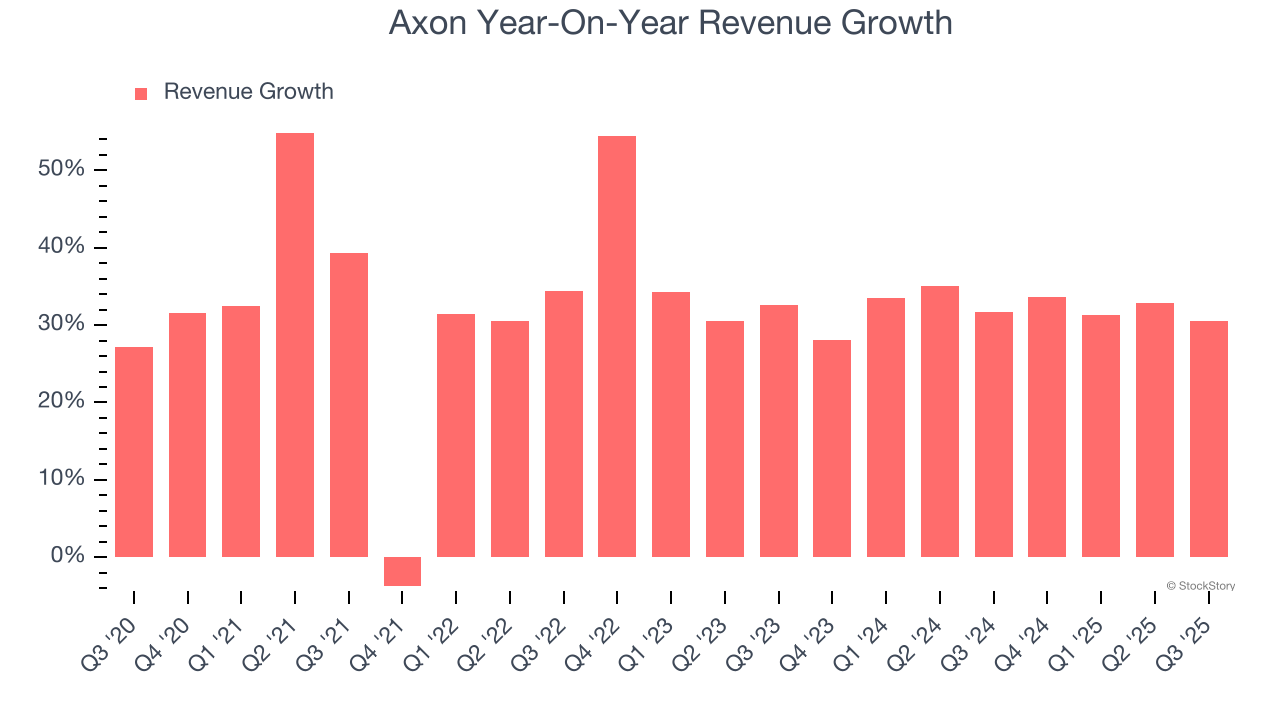
This quarter, Axon reported wonderful year-on-year revenue growth of 30.6%, and its $710.6 million of revenue exceeded Wall Street’s estimates by 0.8%. Company management is currently guiding for a 30.8% year-on-year increase in sales next quarter.
Looking further ahead, sell-side analysts expect revenue to grow 24.8% over the next 12 months, a deceleration versus the last two years. Still, this projection is healthy and implies the market is baking in success for its products and services.
While Wall Street chases Nvidia at all-time highs, an under-the-radar semiconductor supplier is dominating a critical AI component these giants can’t build without. Click here to access our free report one of our favorites growth stories.
Operating Margin
Axon was profitable over the last five years but held back by its large cost base. Its average operating margin of 1.7% was weak for an industrials business.
On the plus side, Axon’s operating margin rose by 14.4 percentage points over the last five years, as its sales growth gave it immense operating leverage.
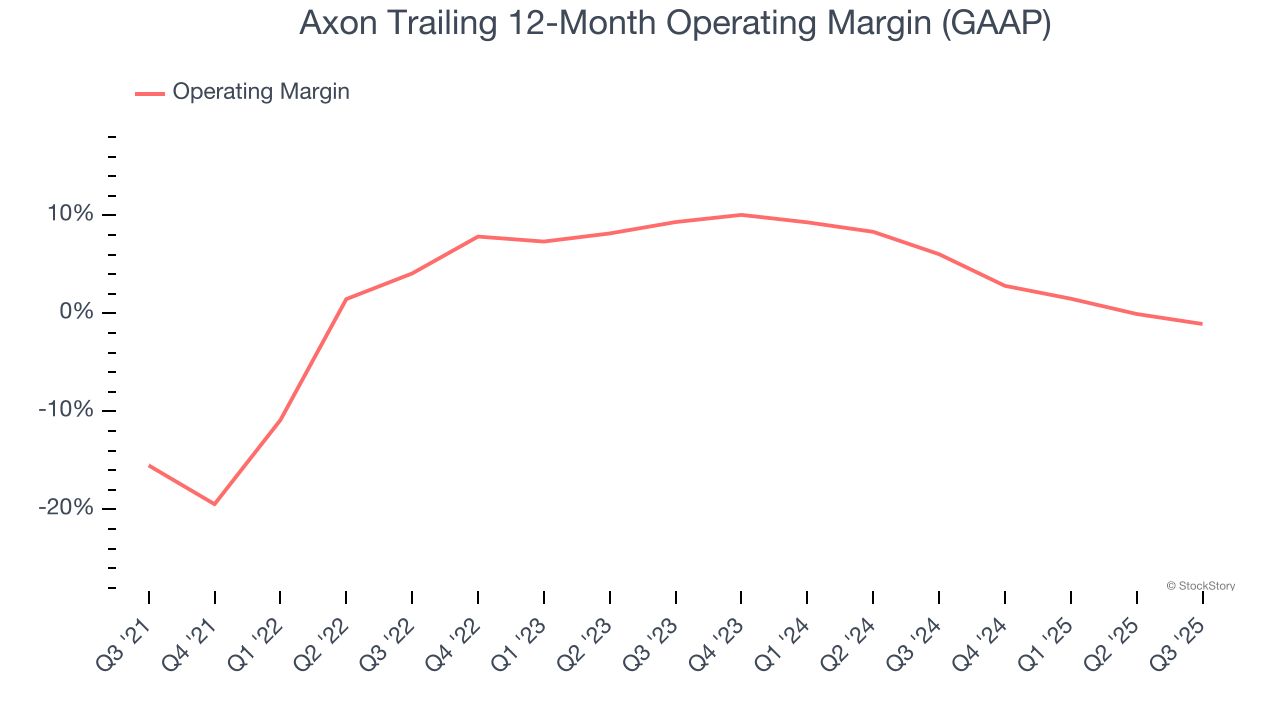
This quarter, Axon’s breakeven margin was down 4.7 percentage points year on year. This contraction shows it was less efficient because its expenses grew faster than its revenue.
Earnings Per Share
Revenue trends explain a company’s historical growth, but the long-term change in earnings per share (EPS) points to the profitability of that growth – for example, a company could inflate its sales through excessive spending on advertising and promotions.
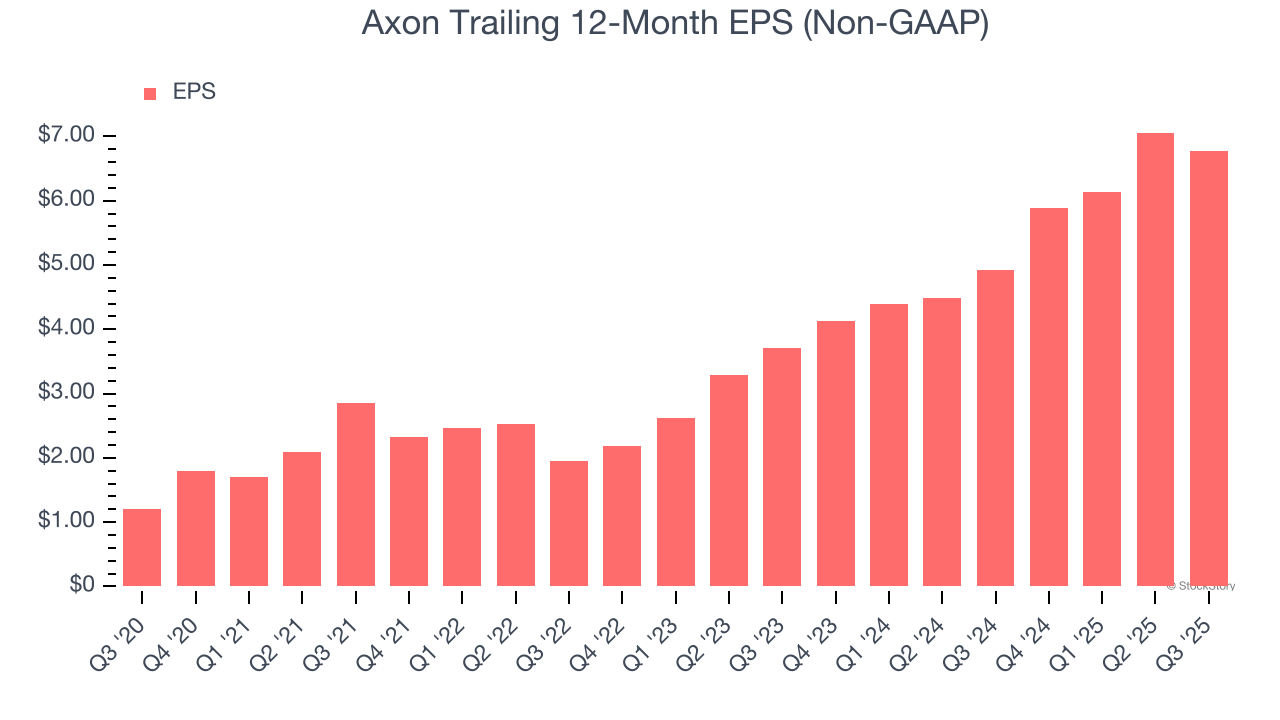
Axon’s EPS grew at an astounding 41.4% compounded annual growth rate over the last five years, higher than its 32.5% annualized revenue growth. This tells us the company became more profitable on a per-share basis as it expanded.
We can take a deeper look into Axon’s earnings quality to better understand the drivers of its performance. As we mentioned earlier, Axon’s operating margin declined this quarter but expanded by 14.4 percentage points over the last five years. This was the most relevant factor (aside from the revenue impact) behind its higher earnings; interest expenses and taxes can also affect EPS but don’t tell us as much about a company’s fundamentals.
Like with revenue, we analyze EPS over a shorter period to see if we are missing a change in the business.
For Axon, its two-year annual EPS growth of 35.2% was lower than its five-year trend. We still think its growth was good and hope it can accelerate in the future.
In Q3, Axon reported adjusted EPS of $1.17, down from $1.45 in the same quarter last year. This print missed analysts’ estimates, but we care more about long-term adjusted EPS growth than short-term movements. Over the next 12 months, Wall Street expects Axon’s full-year EPS of $6.78 to grow 5.3%.
Key Takeaways from Axon’s Q3 Results
It was encouraging to see Axon beat analysts’ revenue and EBITDA expectations this quarter, driven by strong performance in its software and services segment. We were also glad its full-year revenue guidance slightly exceeded Wall Street’s estimates. On the other hand, its EPS missed and its EBITDA guidance for next quarter fell short, making this a weaker quarter. The stock traded down 14.3% to $608 immediately following the results.
Is Axon an attractive investment opportunity at the current price? If you’re making that decision, you should consider the bigger picture of valuation, business qualities, as well as the latest earnings. We cover that in our actionable full research report which you can read here, it’s free for active Edge members.


