Online platform company Coupang (NYSE: CPNG) beat Wall Street’s revenue expectations in Q3 CY2025, with sales up 17.8% year on year to $9.27 billion. Its GAAP profit of $0.05 per share was $0.01 above analysts’ consensus estimates.
Is now the time to buy Coupang? Find out by accessing our full research report, it’s free for active Edge members.
Coupang (CPNG) Q3 CY2025 Highlights:
- Revenue: $9.27 billion vs analyst estimates of $9.02 billion (17.8% year-on-year growth, 2.7% beat)
- EPS (GAAP): $0.05 vs analyst estimates of $0.04 ($0.01 beat)
- Adjusted EBITDA: $413 million vs analyst estimates of $324.4 million (4.5% margin, 27.3% beat)
- Operating Margin: 1.7%, in line with the same quarter last year
- Free Cash Flow Margin: 4.7%, up from 2.9% in the previous quarter
- Active Customers: 24.7 million, up 2.02 million year on year
- Market Capitalization: $58.3 billion
Company Overview
Founded in 2010 by Harvard Business School student Bom Kim, Coupang (NYSE: CPNG) is an e-commerce giant often referred to as the "Amazon of South Korea".
Revenue Growth
Examining a company’s long-term performance can provide clues about its quality. Even a bad business can shine for one or two quarters, but a top-tier one grows for years. Thankfully, Coupang’s 18.3% annualized revenue growth over the last three years was impressive. Its growth beat the average consumer internet company and shows its offerings resonate with customers, a helpful starting point for our analysis.
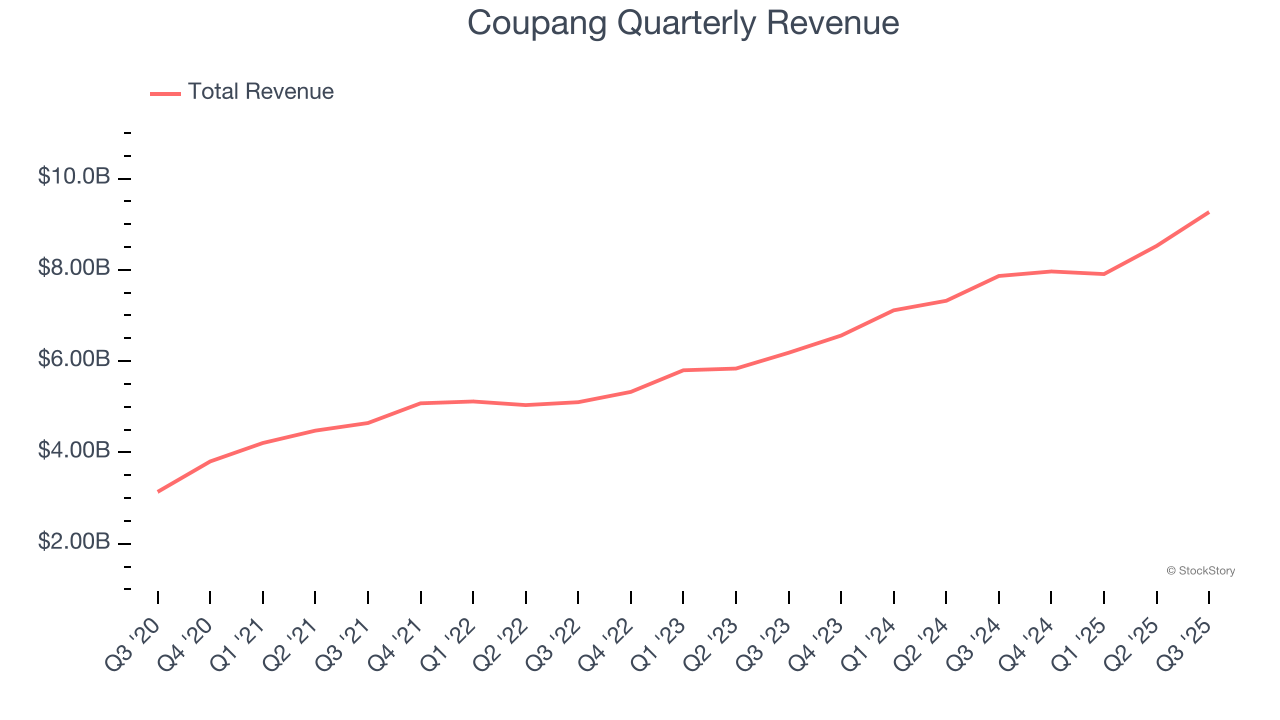
This quarter, Coupang reported year-on-year revenue growth of 17.8%, and its $9.27 billion of revenue exceeded Wall Street’s estimates by 2.7%.
Looking ahead, sell-side analysts expect revenue to grow 16.6% over the next 12 months, a slight deceleration versus the last three years. We still think its growth trajectory is attractive given its scale and suggests the market sees success for its products and services.
Microsoft, Alphabet, Coca-Cola, Monster Beverage—all began as under-the-radar growth stories riding a massive trend. We’ve identified the next one: a profitable AI semiconductor play Wall Street is still overlooking. Go here for access to our full report.
Active Customers
Buyer Growth
As an online retailer, Coupang generates revenue growth by expanding its number of users and the average order size in dollars.
Over the last two years, Coupang’s active customers, a key performance metric for the company, increased by 11.2% annually to 24.7 million in the latest quarter. This growth rate is strong for a consumer internet business and indicates people love using its offerings. 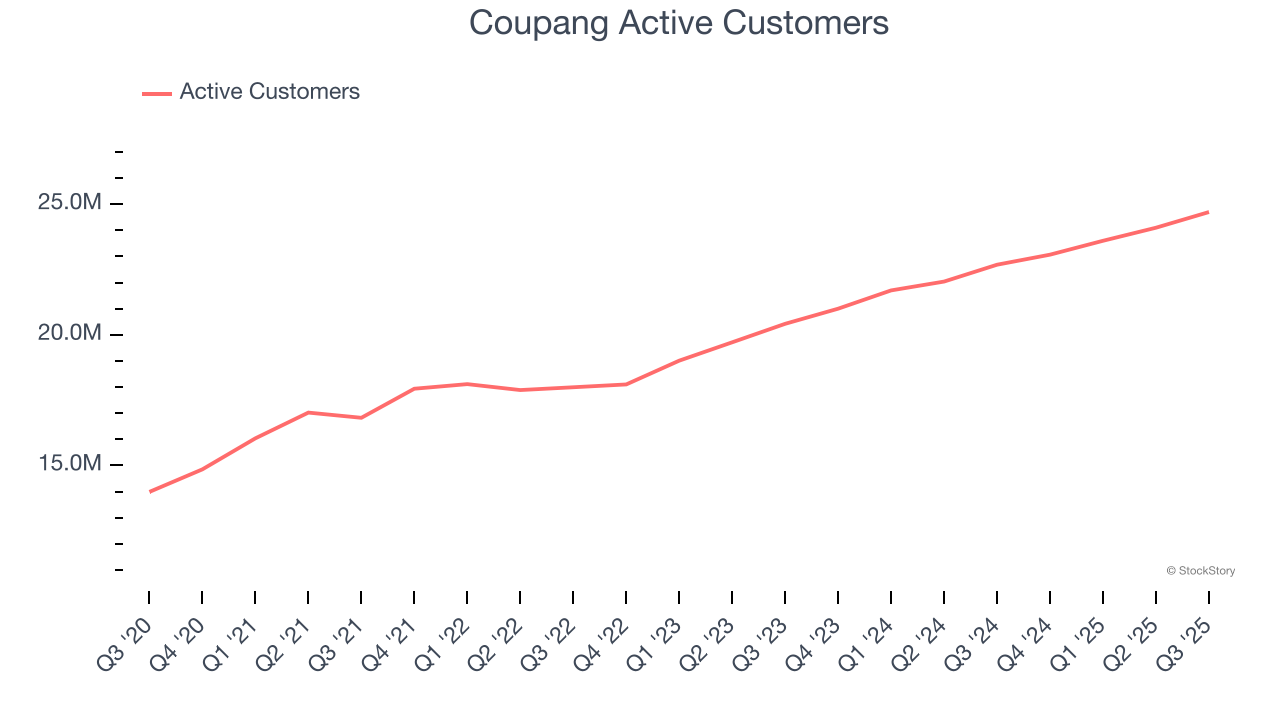
In Q3, Coupang added 2.02 million active customers, leading to 8.9% year-on-year growth. The quarterly print was lower than its two-year result, suggesting its new initiatives aren’t accelerating buyer growth just yet.
Revenue Per Buyer
Average revenue per buyer (ARPB) is a critical metric to track because it measures how much customers spend per order.
Coupang’s ARPB growth has been impressive over the last two years, averaging 8.5%. Its ability to increase monetization while quickly growing its active customers reflects the strength of its platform, as its buyers continue to spend more each year. 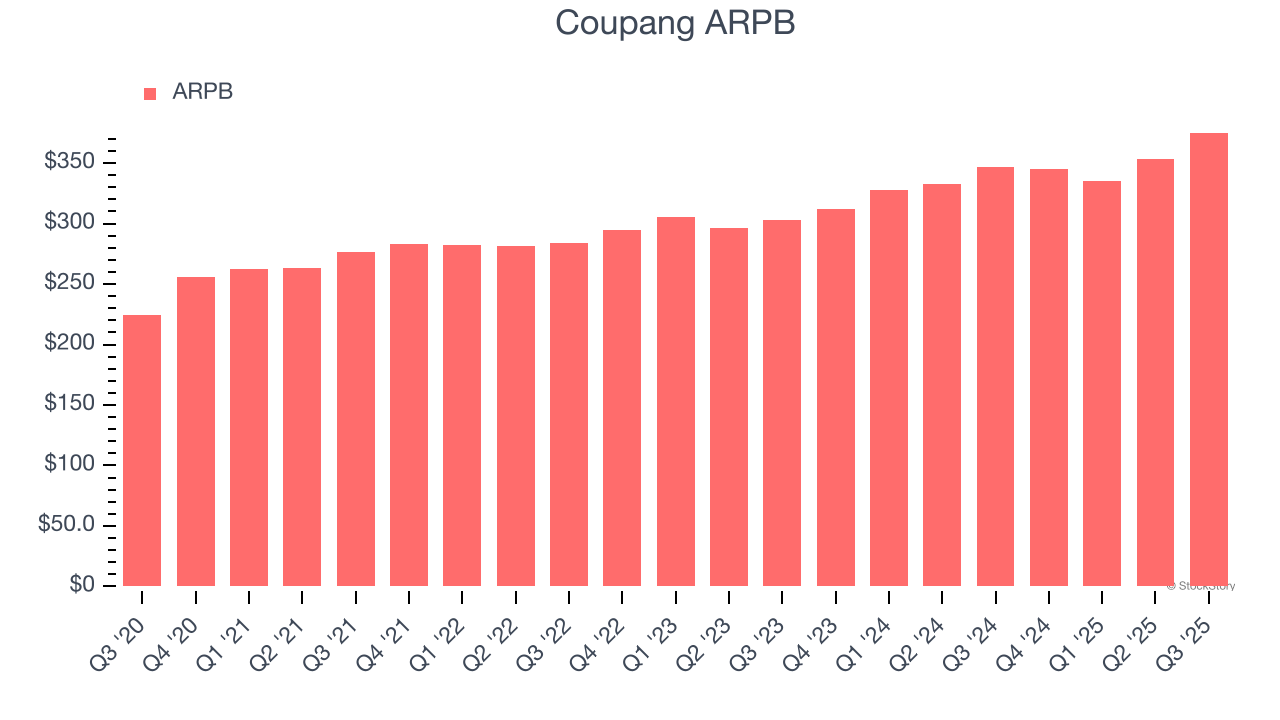
This quarter, Coupang’s ARPB clocked in at $375.18. It grew by 8.2% year on year, mirroring the performance of its active customers.
Key Takeaways from Coupang’s Q3 Results
We were impressed by how significantly Coupang blew past analysts’ EBITDA expectations this quarter. We were also happy its revenue and EPS outperformed Wall Street’s estimates. Overall, we think this was a solid quarter with many key metrics above expectations. The stock remained flat at $32.06 immediately following the results.
So should you invest in Coupang right now? When making that decision, it’s important to consider its valuation, business qualities, as well as what has happened in the latest quarter. We cover that in our actionable full research report which you can read here, it’s free for active Edge members.