ETFOptimize | High-performance ETF-based Investment Strategies

Quantitative strategies, Wall Street-caliber research, and insightful market analysis since 1998.


ETFOptimize | HOME
Close Window

Crane NXT Earnings: What To Look For From CXT

CXT Cover Image

Payment technology company Crane NXT (NYSE: CXT) will be reporting results this Wednesday after the bell. Here’s what to expect.

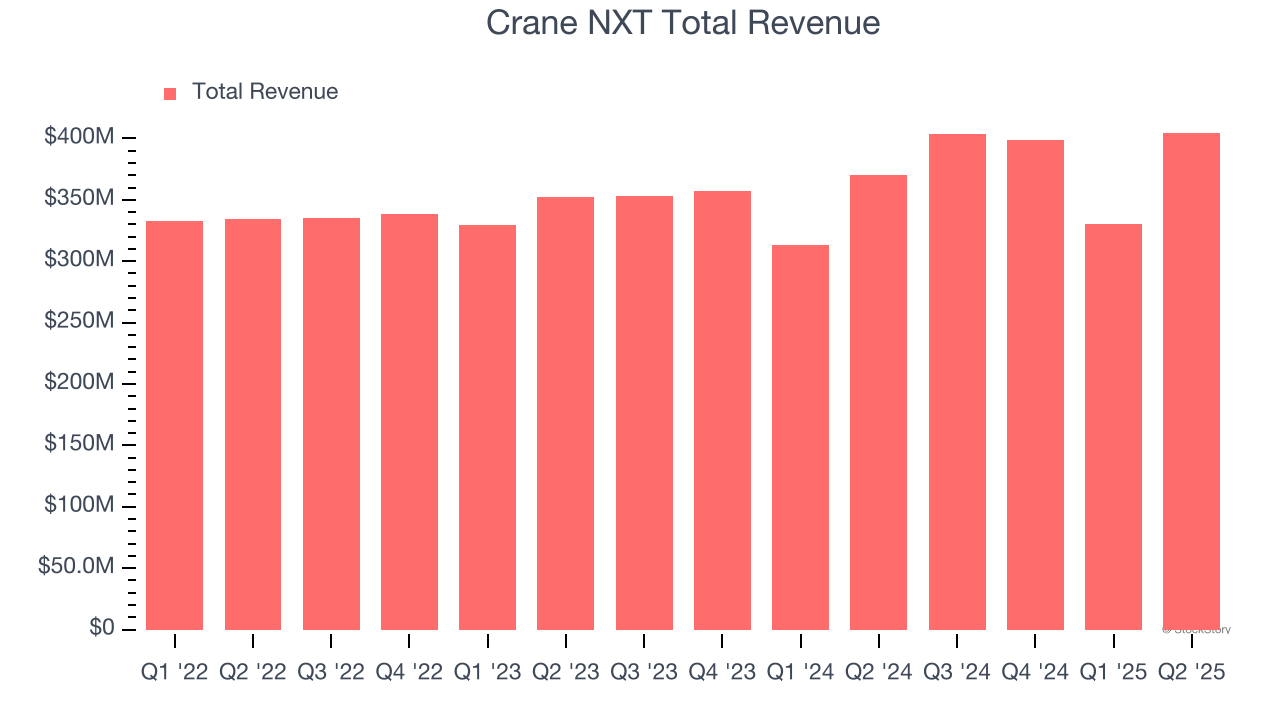
Crane NXT beat analysts’ revenue expectations by 5.9% last quarter, reporting revenues of $404.4 million, up 9.1% year on year. It was a very strong quarter for the company, with an impressive beat of analysts’ organic revenue estimates and a solid beat of analysts’ revenue estimates.

Is Crane NXT a buy or sell going into earnings? Read our full analysis here, it’s free for active Edge members.

This quarter, analysts are expecting Crane NXT’s revenue to grow 6.5% year on year to $429.8 million, slowing from the 14.3% increase it recorded in the same quarter last year. Adjusted earnings are expected to come in at $1.26 per share.

Crane NXT Total Revenue

Analysts covering the company have generally reconfirmed their estimates over the last 30 days, suggesting they anticipate the business to stay the course heading into earnings. Crane NXT has only missed Wall Street’s revenue estimates once over the last two years, exceeding top-line expectations by 2.2% on average.

Looking at Crane NXT’s peers in the specialized technology segment, some have already reported their Q3 results, giving us a hint as to what we can expect. Napco delivered year-on-year revenue growth of 11.7%, beating analysts’ expectations by 4.8%, and Mirion reported revenues up 7.9%, in line with consensus estimates. Mirion traded up 18.1% following the results.

Read our full analysis of Napco’s results here and Mirion’s results here.

The euphoria surrounding Trump’s November win lit a fire under major indices, but potential tariffs have caused the market to do a 180 in 2025. While some of the specialized technology stocks have shown solid performance in this choppy environment, the group has generally underperformed, with share prices down 3.7% on average over the last month. Crane NXT is down 5% during the same time and is heading into earnings with an average analyst price target of $77.33 (compared to the current share price of $64.14).

When a company has more cash than it knows what to do with, buying back its own shares can make a lot of sense–as long as the price is right. Luckily, we’ve found one, a low-priced stock that is gushing free cash flow AND buying back shares. Click here to claim your Special Free Report on a fallen angel growth story that is already recovering from a setback.

StockStory is growing and hiring equity analyst and marketing roles. Are you a 0 to 1 builder passionate about the markets and AI? See the open roles here.

Recent Quotes

View More
Symbol Price Change (%)
AMZN  248.40
+0.00 (0.00%)
AAPL  269.43
+0.00 (0.00%)
AMD  243.98
+0.00 (0.00%)
BAC  53.42
+0.00 (0.00%)
GOOG  290.59
+0.00 (0.00%)
META  631.76
+0.00 (0.00%)
MSFT  506.00
+0.00 (0.00%)
NVDA  199.05
+0.00 (0.00%)
ORCL  240.83
+0.00 (0.00%)
TSLA  445.23
+0.00 (0.00%)
Stock Quote API & Stock News API supplied by www.cloudquote.io
Quotes delayed at least 20 minutes.
By accessing this page, you agree to the Privacy Policy and Terms Of Service.


IntelligentValue Home
Close Window

DISCLAIMER

All content herein is issued solely for informational purposes and is not to be construed as an offer to sell or the solicitation of an offer to buy, nor should it be interpreted as a recommendation to buy, hold or sell (short or otherwise) any security.  All opinions, analyses, and information included herein are based on sources believed to be reliable, but no representation or warranty of any kind, expressed or implied, is made including but not limited to any representation or warranty concerning accuracy, completeness, correctness, timeliness or appropriateness. We undertake no obligation to update such opinions, analysis or information. You should independently verify all information contained on this website. Some information is based on analysis of past performance or hypothetical performance results, which have inherent limitations. We make no representation that any particular equity or strategy will or is likely to achieve profits or losses similar to those shown. Shareholders, employees, writers, contractors, and affiliates associated with ETFOptimize.com may have ownership positions in the securities that are mentioned. If you are not sure if ETFs, algorithmic investing, or a particular investment is right for you, you are urged to consult with a Registered Investment Advisor (RIA). Neither this website nor anyone associated with producing its content are Registered Investment Advisors, and no attempt is made herein to substitute for personalized, professional investment advice. Neither ETFOptimize.com, Global Alpha Investments, Inc., nor its employees, service providers, associates, or affiliates are responsible for any investment losses you may incur as a result of using the information provided herein. Remember that past investment returns may not be indicative of future returns.

Copyright © 1998-2017 ETFOptimize.com, a publication of Optimized Investments, Inc. All rights reserved.