
Discount grocery store chain Grocery Outlet (NASDAQ: GO) fell short of the markets revenue expectations in Q3 CY2025, but sales rose 5.4% year on year to $1.17 billion. On the other hand, the company’s outlook for the full year was close to analysts’ estimates with revenue guided to $4.71 billion at the midpoint. Its non-GAAP profit of $0.21 per share was 11.5% above analysts’ consensus estimates.
Is now the time to buy Grocery Outlet? Find out by accessing our full research report, it’s free for active Edge members.
Grocery Outlet (GO) Q3 CY2025 Highlights:
- Revenue: $1.17 billion vs analyst estimates of $1.18 billion (5.4% year-on-year growth, 0.8% miss)
- Adjusted EPS: $0.21 vs analyst estimates of $0.19 (11.5% beat)
- Adjusted EBITDA: $66.67 million vs analyst estimates of $67.47 million (5.7% margin, 1.2% miss)
- The company dropped its revenue guidance for the full year to $4.71 billion at the midpoint from $4.75 billion, a 0.8% decrease
- Management raised its full-year Adjusted EPS guidance to $0.79 at the midpoint, a 1.9% increase
- EBITDA guidance for the full year is $260 million at the midpoint, below analyst estimates of $264.7 million
- Operating Margin: 2%, down from 3.6% in the same quarter last year
- Free Cash Flow was -$21.57 million compared to -$19.34 million in the same quarter last year
- Locations: 563 at quarter end, up from 529 in the same quarter last year
- Same-Store Sales rose 1.2% year on year, in line with the same quarter last year
- Market Capitalization: $1.40 billion
“In the third quarter, we made progress on our key initiatives while delivering strong bottom-line results. In addition, we launched our store refresh program at an initial group of pilot stores,” said Jason Potter, President and CEO of Grocery Outlet.
Company Overview
Due to its differentiated procurement and buying approach, Grocery Outlet (NASDAQ: GO) is a discount grocery store chain that offers substantial discounts on name-brand products.
Revenue Growth
Reviewing a company’s long-term sales performance reveals insights into its quality. Any business can put up a good quarter or two, but the best consistently grow over the long haul.
With $4.57 billion in revenue over the past 12 months, Grocery Outlet is a small retailer, which sometimes brings disadvantages compared to larger competitors benefiting from economies of scale and negotiating leverage with suppliers. On the bright side, it can grow faster because it has more white space to build new stores.
As you can see below, Grocery Outlet’s sales grew at a decent 10.7% compounded annual growth rate over the last six years (we compare to 2019 to normalize for COVID-19 impacts) as it opened new stores and increased sales at existing, established locations.
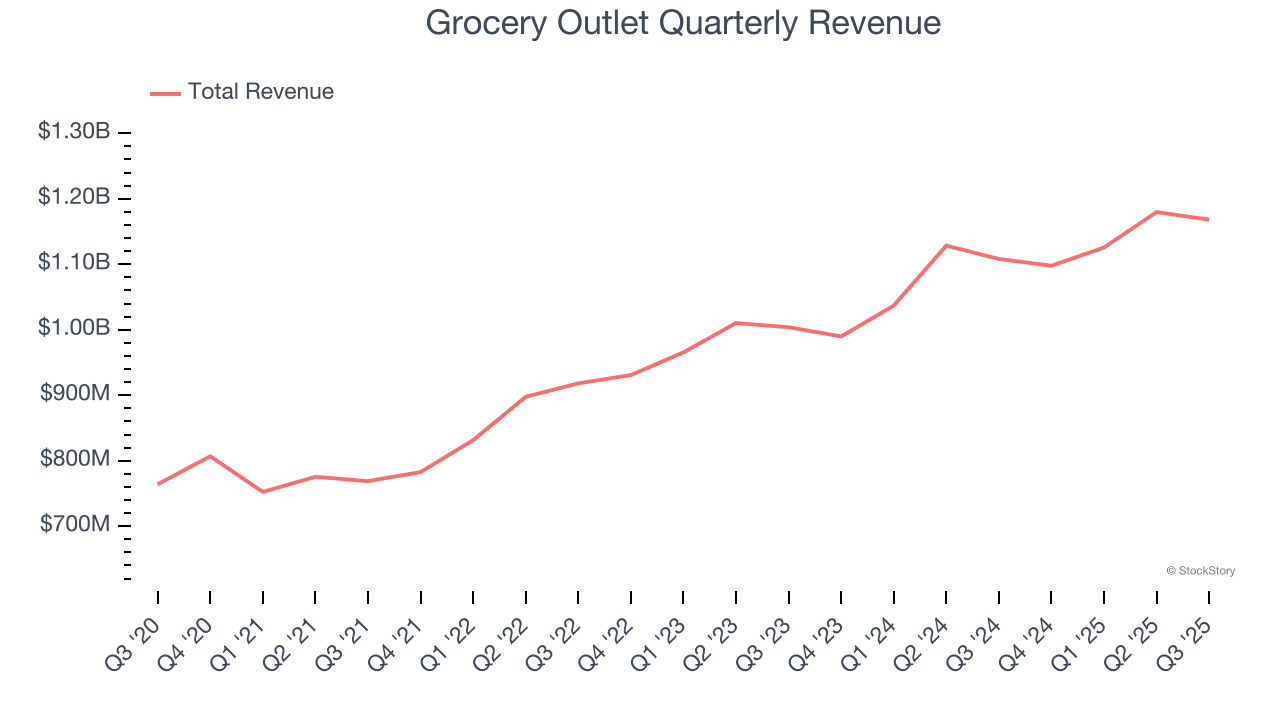
This quarter, Grocery Outlet’s revenue grew by 5.4% year on year to $1.17 billion, missing Wall Street’s estimates.
Looking ahead, sell-side analysts expect revenue to grow 8.5% over the next 12 months, a slight deceleration versus the last six years. Despite the slowdown, this projection is healthy and implies the market is forecasting success for its products.
Software is eating the world and there is virtually no industry left that has been untouched by it. That drives increasing demand for tools helping software developers do their jobs, whether it be monitoring critical cloud infrastructure, integrating audio and video functionality, or ensuring smooth content streaming. Click here to access a free report on our 3 favorite stocks to play this generational megatrend.
Store Performance
Number of Stores
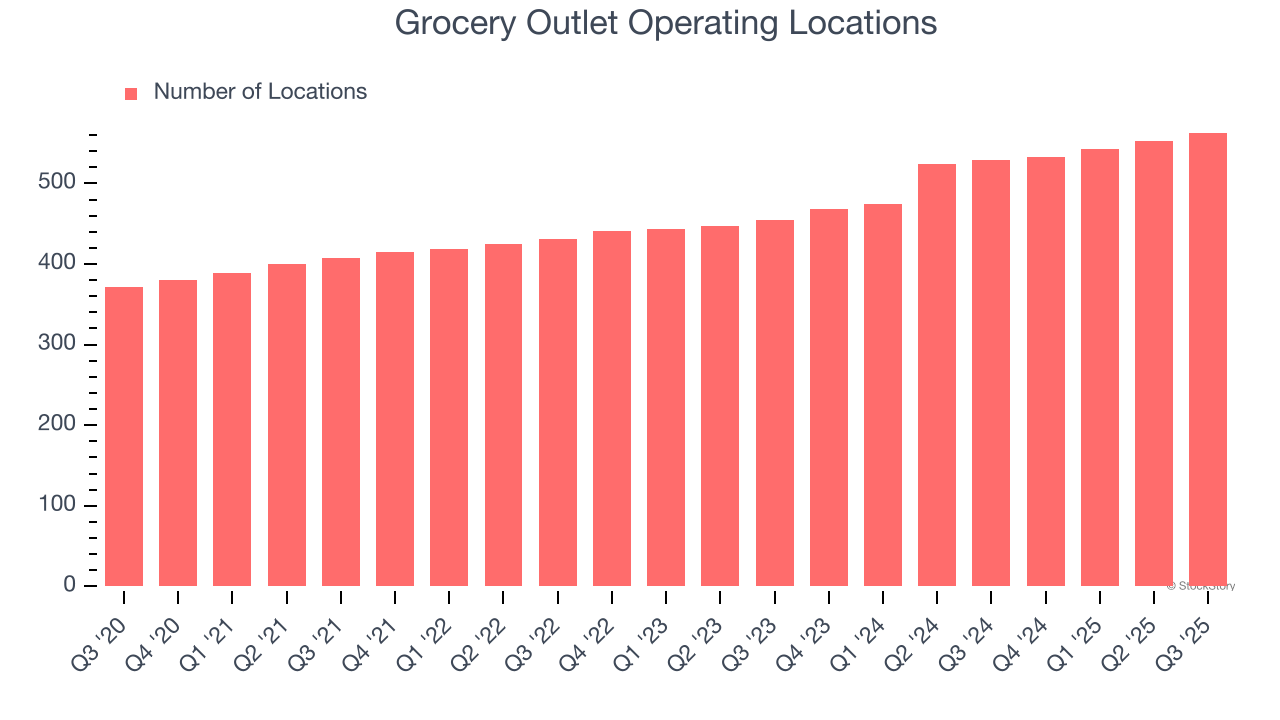
The number of stores a retailer operates is a critical driver of how quickly company-level sales can grow.
Grocery Outlet operated 563 locations in the latest quarter. It has opened new stores at a rapid clip over the last two years, averaging 10.8% annual growth, much faster than the broader consumer retail sector. This gives it a chance to scale into a mid-sized business over time.
When a retailer opens new stores, it usually means it’s investing for growth because demand is greater than supply, especially in areas where consumers may not have a store within reasonable driving distance.
Same-Store Sales
The change in a company's store base only tells one side of the story. The other is the performance of its existing locations and e-commerce sales, which informs management teams whether they should expand or downsize their physical footprints. Same-store sales is an industry measure of whether revenue is growing at those existing stores and is driven by customer visits (often called traffic) and the average spending per customer (ticket).
Grocery Outlet’s demand rose over the last two years and slightly outpaced the industry. On average, the company’s same-store sales have grown by 2% per year. This performance gives it the confidence to meaningfully expand its store base.
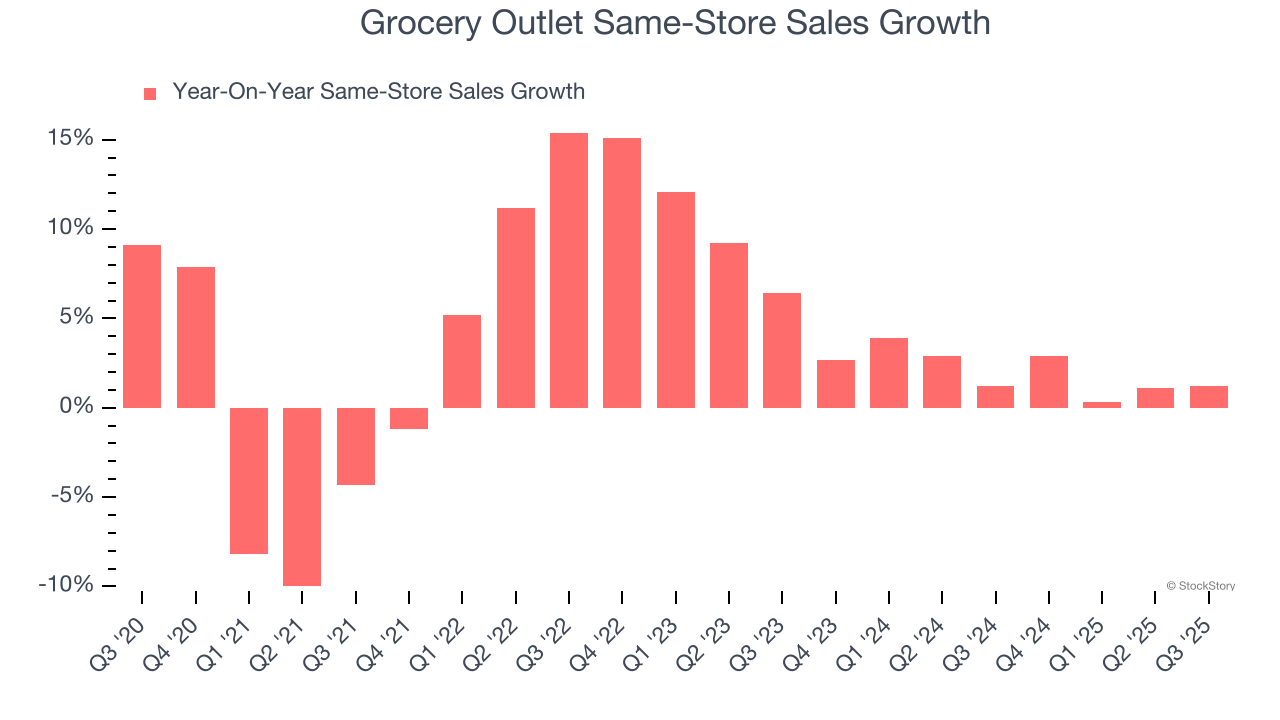
In the latest quarter, Grocery Outlet’s same-store sales rose 1.2% year on year. This performance was more or less in line with its historical levels.
Key Takeaways from Grocery Outlet’s Q3 Results
It was good to see Grocery Outlet beat analysts’ EPS expectations this quarter. On the other hand, it lowered its full-year revenue and EBITDA guidance, falling short of Wall Street’s estimates. Overall, this was a softer quarter. The stock traded down 4.9% to $13.50 immediately following the results.
So should you invest in Grocery Outlet right now? When making that decision, it’s important to consider its valuation, business qualities, as well as what has happened in the latest quarter. We cover that in our actionable full research report which you can read here, it’s free for active Edge members.