
Residential swimming pool manufacturer Latham (NASDAQ: SWIM) missed Wall Street’s revenue expectations in Q3 CY2025, but sales rose 7.6% year on year to $161.9 million. Its GAAP profit of $0.07 per share was 29.7% below analysts’ consensus estimates.
Is now the time to buy Latham? Find out by accessing our full research report, it’s free for active Edge members.
Latham (SWIM) Q3 CY2025 Highlights:
- Revenue: $161.9 million vs analyst estimates of $164.8 million (7.6% year-on-year growth, 1.8% miss)
- EPS (GAAP): $0.07 vs analyst expectations of $0.10 (29.7% miss)
- Adjusted EBITDA: $38.33 million vs analyst estimates of $35.69 million (23.7% margin, 7.4% beat)
- EBITDA guidance for the full year is $95 million at the midpoint, above analyst estimates of $93.51 million
- Operating Margin: 13.3%, up from 8.9% in the same quarter last year
- Free Cash Flow Margin: 27.9%, up from 22.1% in the same quarter last year
- Market Capitalization: $847.3 million
Commenting on the results, Scott Rajeski, President and CEO, said, “In the third quarter, we continued to execute effectively on our strategic priorities – driving the awareness and adoption of fiberglass pools and autocovers, strengthening our position in the Sand State markets, and expanding margins through lean manufacturing, value engineering, and accretive acquisitions.
Company Overview
Started as a family business, Latham (NASDAQ: SWIM) is a global designer and manufacturer of in-ground residential swimming pools and related products.
Revenue Growth
A company’s long-term performance is an indicator of its overall quality. Any business can experience short-term success, but top-performing ones enjoy sustained growth for years. Over the last five years, Latham grew its sales at a sluggish 8.9% compounded annual growth rate. This was below our standard for the consumer discretionary sector and is a poor baseline for our analysis.
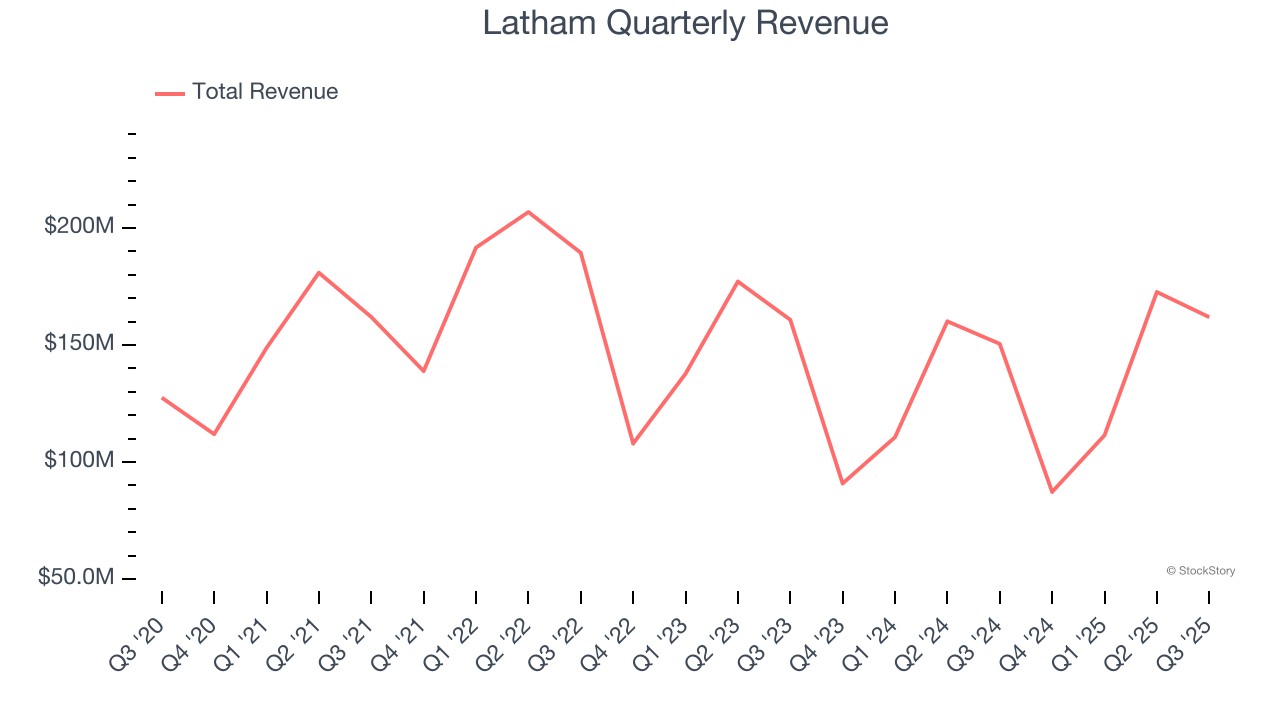
We at StockStory place the most emphasis on long-term growth, but within consumer discretionary, a stretched historical view may miss a company riding a successful new product or trend. Latham’s performance shows it grew in the past but relinquished its gains over the last two years, as its revenue fell by 4.4% annually. 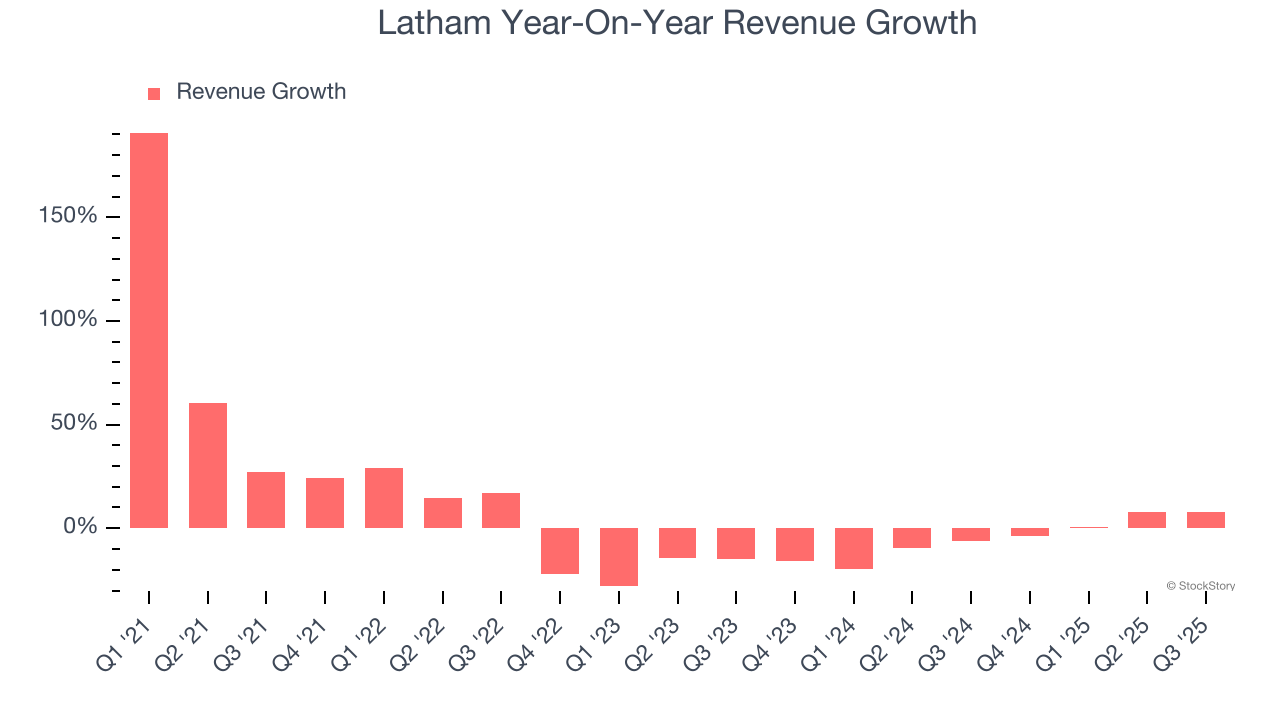
This quarter, Latham’s revenue grew by 7.6% year on year to $161.9 million, missing Wall Street’s estimates.
Looking ahead, sell-side analysts expect revenue to grow 6.5% over the next 12 months. Although this projection indicates its newer products and services will catalyze better top-line performance, it is still below the sector average.
The 1999 book Gorilla Game predicted Microsoft and Apple would dominate tech before it happened. Its thesis? Identify the platform winners early. Today, enterprise software companies embedding generative AI are becoming the new gorillas. a profitable, fast-growing enterprise software stock that is already riding the automation wave and looking to catch the generative AI next.
Operating Margin
Operating margin is an important measure of profitability as it shows the portion of revenue left after accounting for all core expenses – everything from the cost of goods sold to advertising and wages. It’s also useful for comparing profitability across companies with different levels of debt and tax rates because it excludes interest and taxes.
Latham’s operating margin might fluctuated slightly over the last 12 months but has remained more or less the same, averaging 4.8% over the last two years. This profitability was lousy for a consumer discretionary business and caused by its suboptimal cost structure.
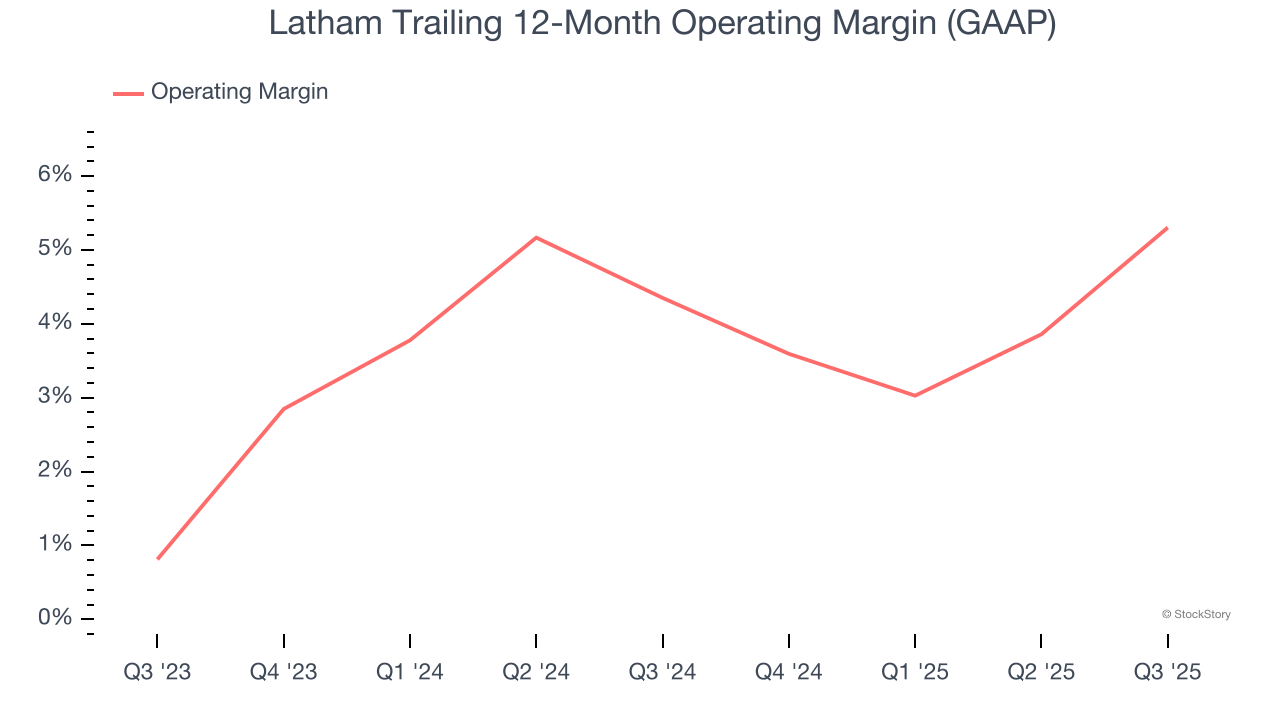
This quarter, Latham generated an operating margin profit margin of 13.3%, up 4.4 percentage points year on year. This increase was a welcome development and shows it was more efficient.
Earnings Per Share
Revenue trends explain a company’s historical growth, but the long-term change in earnings per share (EPS) points to the profitability of that growth – for example, a company could inflate its sales through excessive spending on advertising and promotions.
Sadly for Latham, its EPS declined by 6.5% annually over the last five years while its revenue grew by 8.9%. This tells us the company became less profitable on a per-share basis as it expanded.
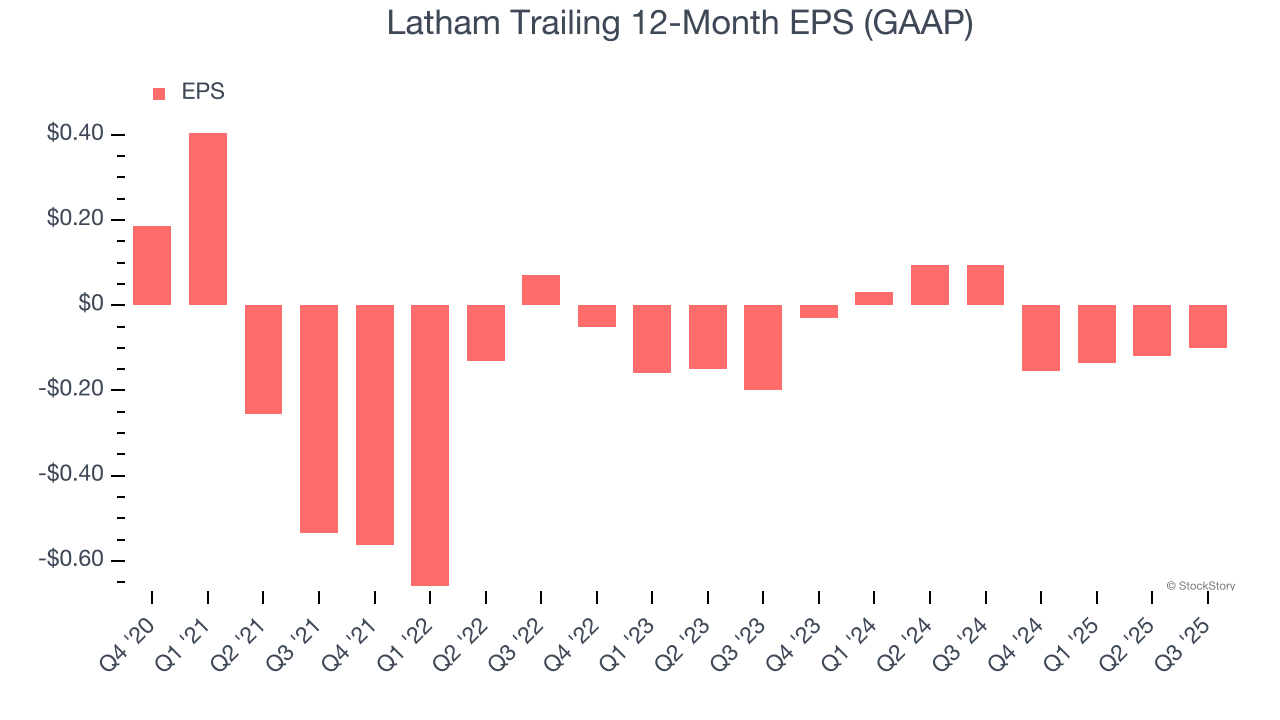
In Q3, Latham reported EPS of $0.07, up from $0.05 in the same quarter last year. Despite growing year on year, this print missed analysts’ estimates. Over the next 12 months, Wall Street is optimistic. Analysts forecast Latham’s full-year EPS of negative $0.10 will flip to positive $0.10.
Key Takeaways from Latham’s Q3 Results
It was encouraging to see Latham beat analysts’ EBITDA expectations this quarter. We were also glad its full-year EBITDA guidance exceeded Wall Street’s estimates. On the other hand, its EPS missed and its revenue fell short of Wall Street’s estimates. Overall, this was a softer quarter. The stock remained flat at $7.20 immediately after reporting.
Is Latham an attractive investment opportunity right now? The latest quarter does matter, but not nearly as much as longer-term fundamentals and valuation, when deciding if the stock is a buy. We cover that in our actionable full research report which you can read here, it’s free for active Edge members.


