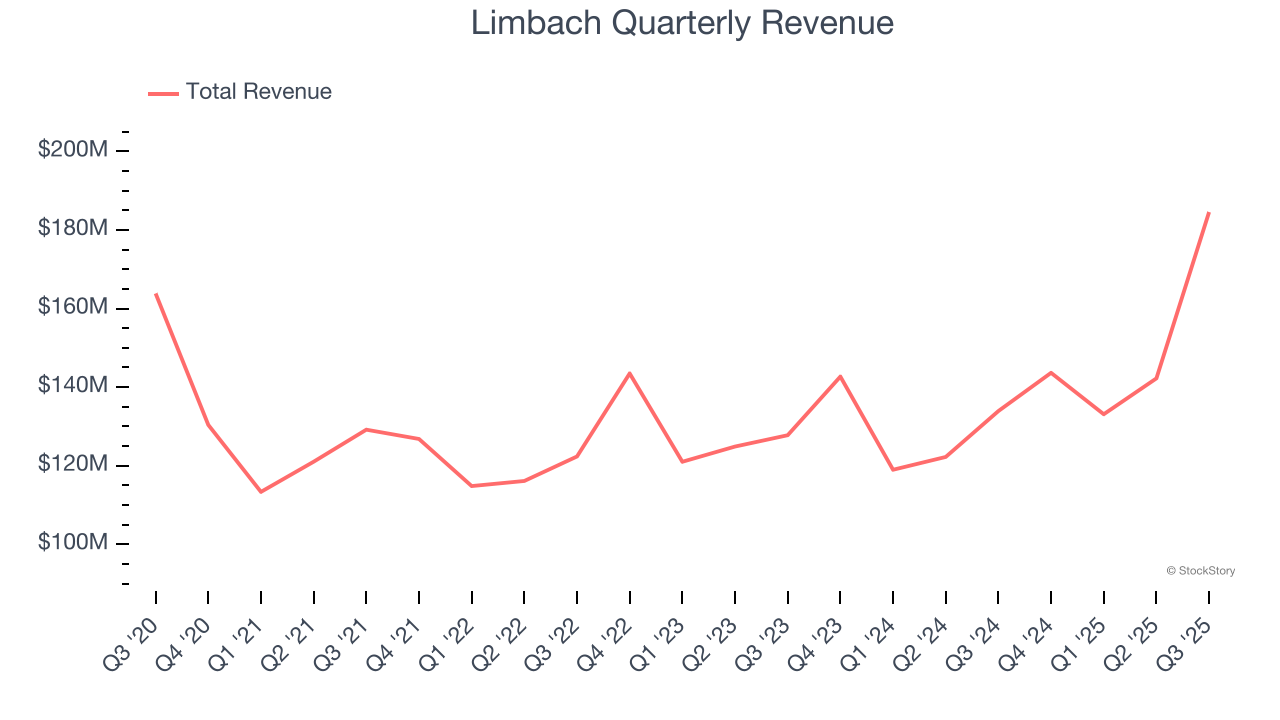
Building systems company Limbach (NASDAQ: LMB) met Wall Streets revenue expectations in Q3 CY2025, with sales up 37.8% year on year to $184.6 million. The company’s full-year revenue guidance of $665 million at the midpoint came in 0.7% above analysts’ estimates. Its non-GAAP profit of $1.05 per share was in line with analysts’ consensus estimates.
Is now the time to buy Limbach? Find out by accessing our full research report, it’s free for active Edge members.
Limbach (LMB) Q3 CY2025 Highlights:
- Revenue: $184.6 million vs analyst estimates of $184.5 million (37.8% year-on-year growth, in line)
- Adjusted EPS: $1.05 vs analyst estimates of $1.05 (in line)
- Adjusted EBITDA: $21.77 million vs analyst estimates of $22.63 million (11.8% margin, 3.8% miss)
- The company reconfirmed its revenue guidance for the full year of $665 million at the midpoint
- EBITDA guidance for the full year is $83 million at the midpoint, above analyst estimates of $81.82 million
- Operating Margin: 7.2%, down from 8.6% in the same quarter last year
- Free Cash Flow Margin: 7%, up from 3.4% in the same quarter last year
- Market Capitalization: $1.09 billion
“We are pleased to report a solid third quarter, underscoring the success of our strategic transition to higher margin ODR business,” said Michael McCann, President and Chief Executive Officer of Limbach.
Company Overview
Established in 1901, Limbach (NASDAQ: LMB) provides integrated building systems solutions, including mechanical, electrical, and plumbing services.
Revenue Growth
A company’s long-term sales performance can indicate its overall quality. Even a bad business can shine for one or two quarters, but a top-tier one grows for years. Unfortunately, Limbach struggled to consistently increase demand as its $603.6 million of sales for the trailing 12 months was close to its revenue five years ago. This wasn’t a great result, but there are still things to like about Limbach.
We at StockStory place the most emphasis on long-term growth, but within industrials, a half-decade historical view may miss cycles, industry trends, or a company capitalizing on catalysts such as a new contract win or a successful product line. Limbach’s annualized revenue growth of 8% over the last two years is above its five-year trend, suggesting some bright spots. 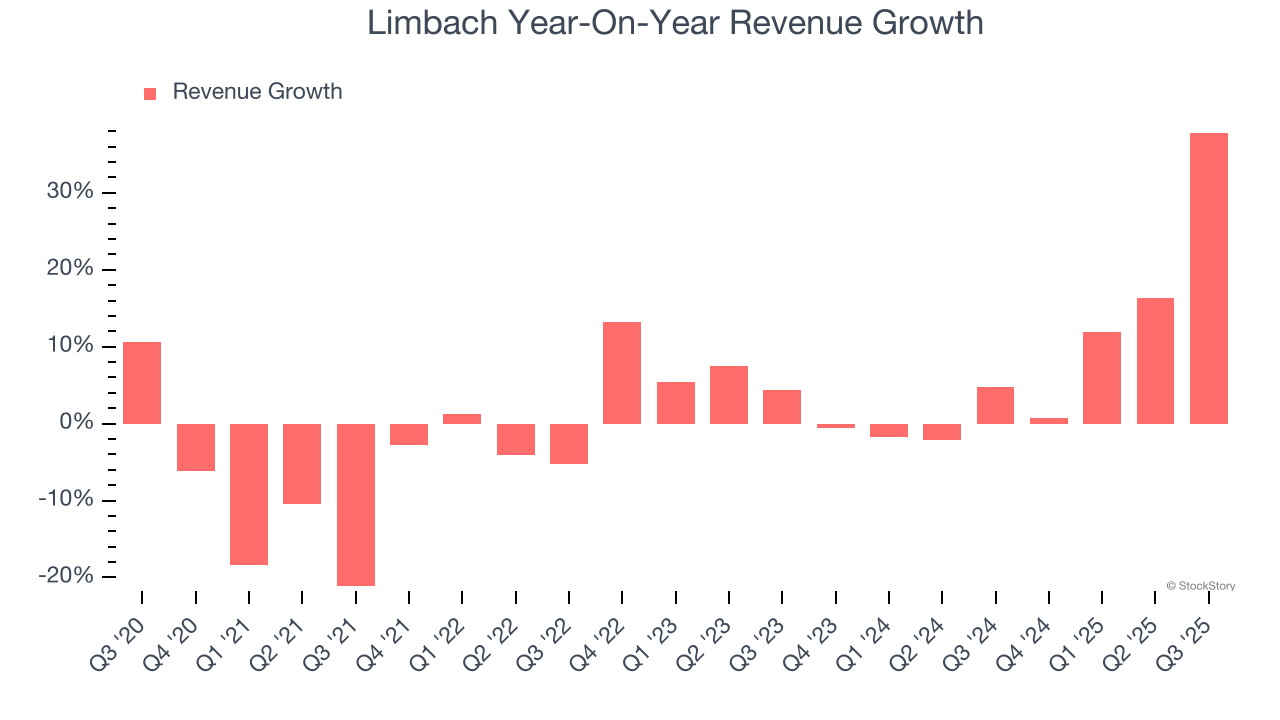
This quarter, Limbach’s year-on-year revenue growth of 37.8% was wonderful, and its $184.6 million of revenue was in line with Wall Street’s estimates.
Looking ahead, sell-side analysts expect revenue to grow 22.7% over the next 12 months, an improvement versus the last two years. This projection is eye-popping and indicates its newer products and services will fuel better top-line performance.
Microsoft, Alphabet, Coca-Cola, Monster Beverage—all began as under-the-radar growth stories riding a massive trend. We’ve identified the next one: a profitable AI semiconductor play Wall Street is still overlooking. Go here for access to our full report.
Operating Margin
Operating margin is a key measure of profitability. Think of it as net income - the bottom line - excluding the impact of taxes and interest on debt, which are less connected to business fundamentals.
Limbach was profitable over the last five years but held back by its large cost base. Its average operating margin of 5.3% was weak for an industrials business. This result isn’t too surprising given its low gross margin as a starting point.
On the plus side, Limbach’s operating margin rose by 5.9 percentage points over the last five years.
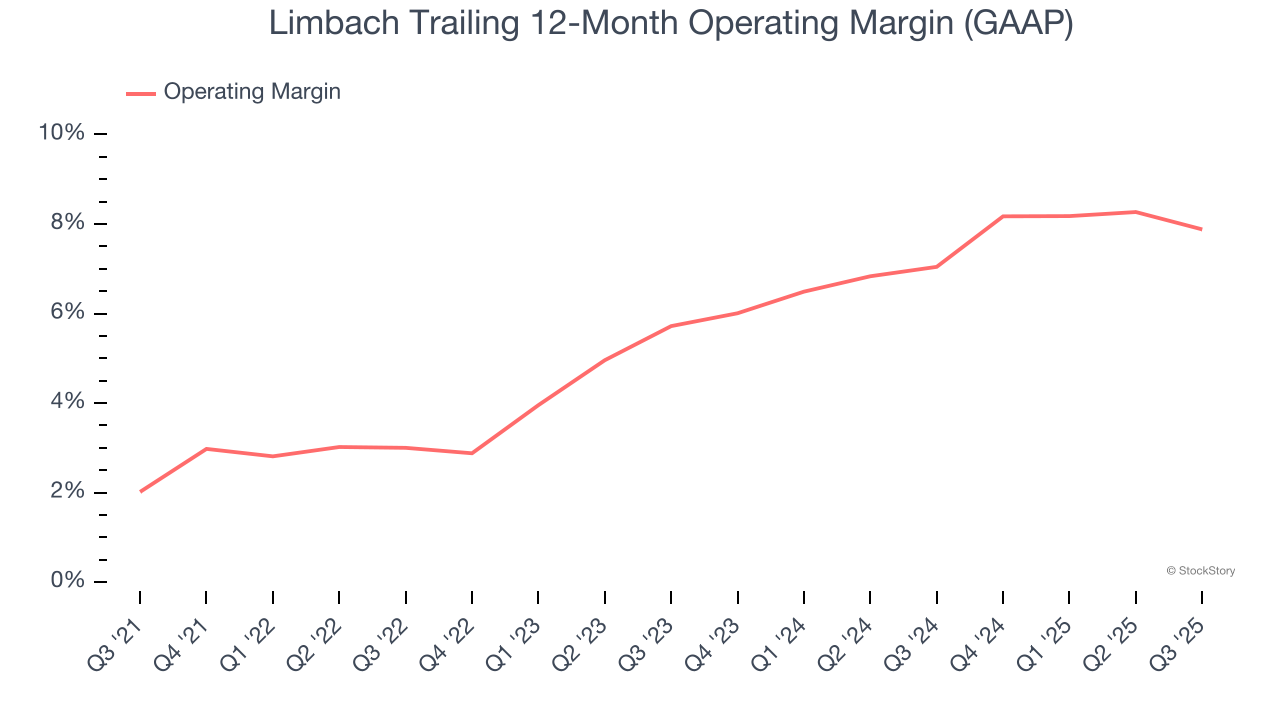
In Q3, Limbach generated an operating margin profit margin of 7.2%, down 1.4 percentage points year on year. Since Limbach’s gross margin decreased more than its operating margin, we can assume its recent inefficiencies were driven more by weaker leverage on its cost of sales rather than increased marketing, R&D, and administrative overhead expenses.
Earnings Per Share
Revenue trends explain a company’s historical growth, but the long-term change in earnings per share (EPS) points to the profitability of that growth – for example, a company could inflate its sales through excessive spending on advertising and promotions.
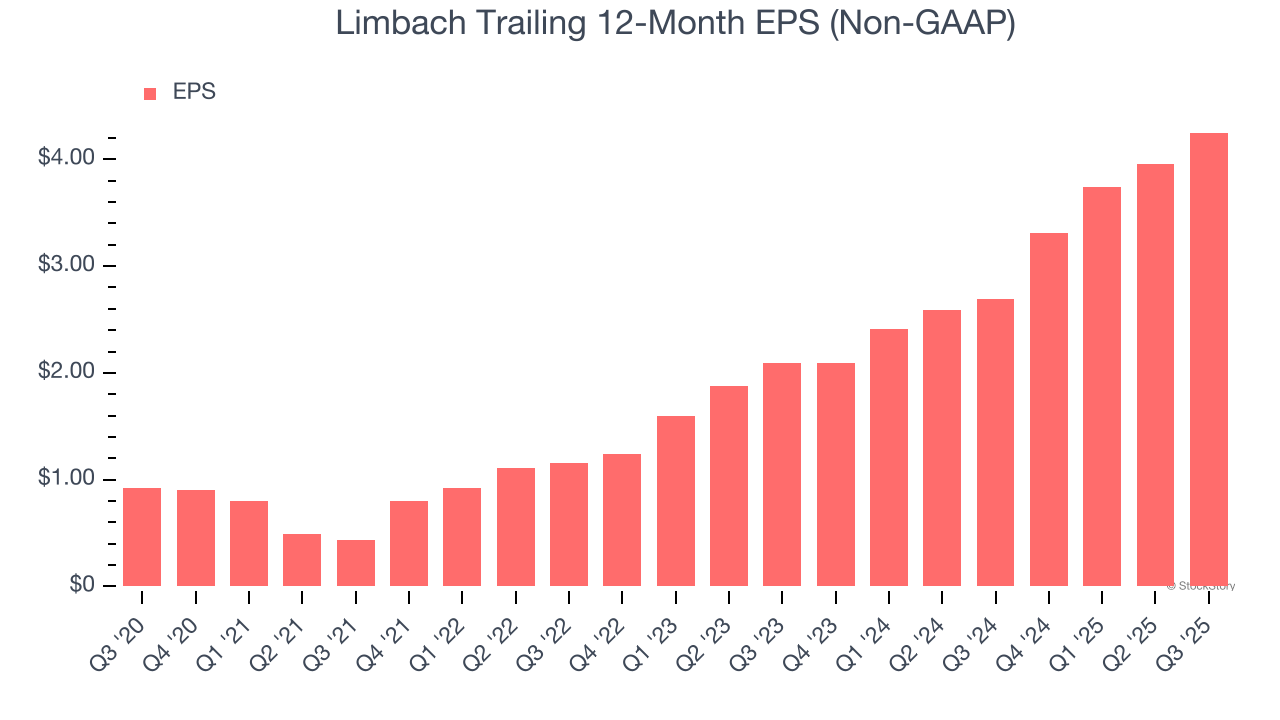
Limbach’s EPS grew at an astounding 35.8% compounded annual growth rate over the last five years, higher than its flat revenue. This tells us management responded to softer demand by adapting its cost structure.
Diving into Limbach’s quality of earnings can give us a better understanding of its performance. As we mentioned earlier, Limbach’s operating margin declined this quarter but expanded by 5.9 percentage points over the last five years. This was the most relevant factor (aside from the revenue impact) behind its higher earnings; interest expenses and taxes can also affect EPS but don’t tell us as much about a company’s fundamentals.
Like with revenue, we analyze EPS over a more recent period because it can provide insight into an emerging theme or development for the business.
For Limbach, its two-year annual EPS growth of 42.5% was higher than its five-year trend. We love it when earnings growth accelerates, especially when it accelerates off an already high base.
In Q3, Limbach reported adjusted EPS of $1.05, up from $0.75 in the same quarter last year. This print was close to analysts’ estimates. Over the next 12 months, Wall Street expects Limbach’s full-year EPS of $4.25 to grow 4.5%.
Key Takeaways from Limbach’s Q3 Results
It was good to see Limbach provide full-year EBITDA guidance that slightly beat analysts’ expectations. We were also glad its full-year revenue guidance slightly exceeded Wall Street’s estimates. On the other hand, its EBITDA missed. Zooming out, we think this was a mixed quarter. Investors were likely hoping for more, and shares traded down 7.1% to $83.99 immediately following the results.
Is Limbach an attractive investment opportunity right now? We think that the latest quarter is only one piece of the longer-term business quality puzzle. Quality, when combined with valuation, can help determine if the stock is a buy. We cover that in our actionable full research report which you can read here, it’s free for active Edge members.