
Healthcare tech company Premier (NASDAQ: PINC) fell short of the markets revenue expectations in Q3 CY2025, with sales falling 3.3% year on year to $240 million. Its non-GAAP profit of $0.32 per share was 17.5% above analysts’ consensus estimates.
Is now the time to buy Premier? Find out by accessing our full research report, it’s free for active Edge members.
Premier (PINC) Q3 CY2025 Highlights:
- The company previously announced the signing of a definitive agreement to be acquired by an affiliate of Patient Square Capital, LP ("Patient Square Capital"). As a result of the pending acquisition, Premier is withdrawing previously issued, and is no longer providing, fiscal-year 2026 guidance.
- Revenue: $240 million vs analyst estimates of $242.3 million (3.3% year-on-year decline, 1% miss)
- Adjusted EPS: $0.32 vs analyst estimates of $0.27 (17.5% beat)
- Adjusted EBITDA: $56.1 million vs analyst estimates of $47.62 million (23.4% margin, 17.8% beat)
- Operating Margin: 10.4%, down from 14.2% in the same quarter last year
- Free Cash Flow was -$3.65 million, down from $49.93 million in the same quarter last year
- Market Capitalization: $2.33 billion
Company Overview
Operating one of the largest healthcare group purchasing organizations in the United States with over 4,350 hospital members, Premier (NASDAQ: PINC) is a technology-driven healthcare improvement company that helps hospitals, health systems, and other providers reduce costs and improve clinical outcomes.
Revenue Growth
A company’s long-term sales performance can indicate its overall quality. Any business can experience short-term success, but top-performing ones enjoy sustained growth for years. Premier struggled to consistently generate demand over the last five years as its sales dropped at a 5.7% annual rate. This was below our standards and is a sign of poor business quality.
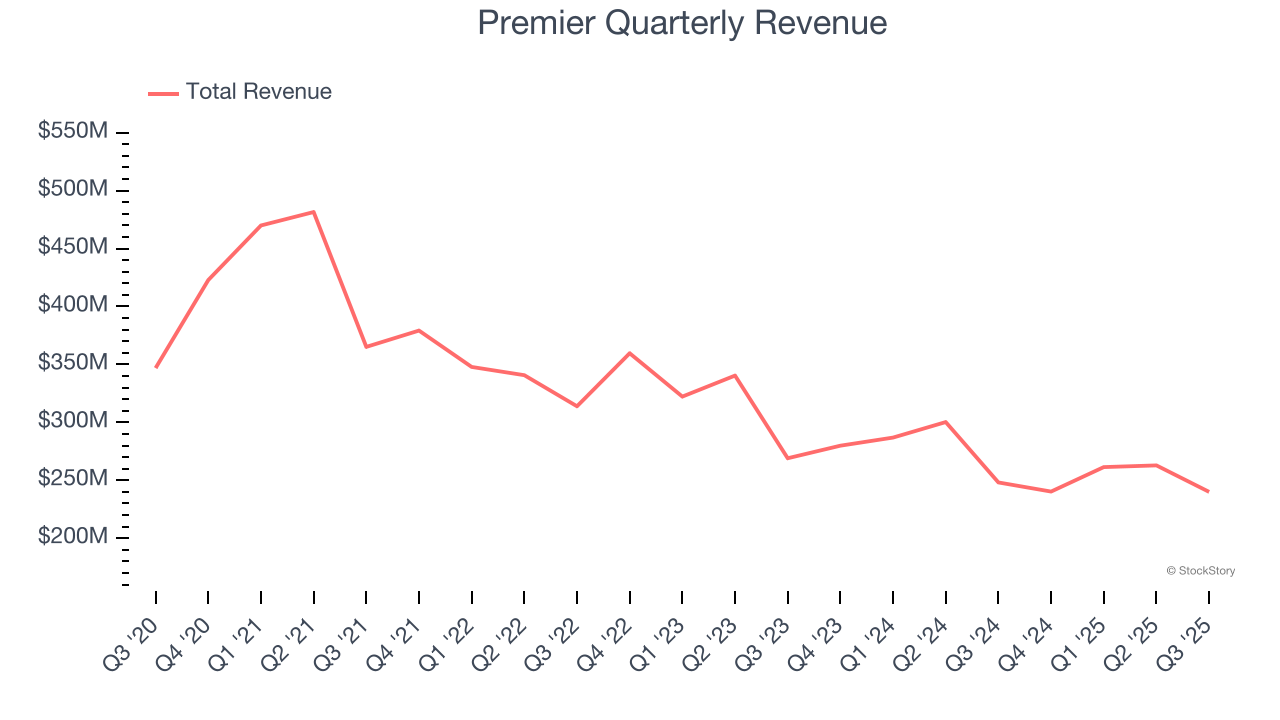
Long-term growth is the most important, but within healthcare, a half-decade historical view may miss new innovations or demand cycles. Premier’s recent performance shows its demand remained suppressed as its revenue has declined by 11.8% annually over the last two years. 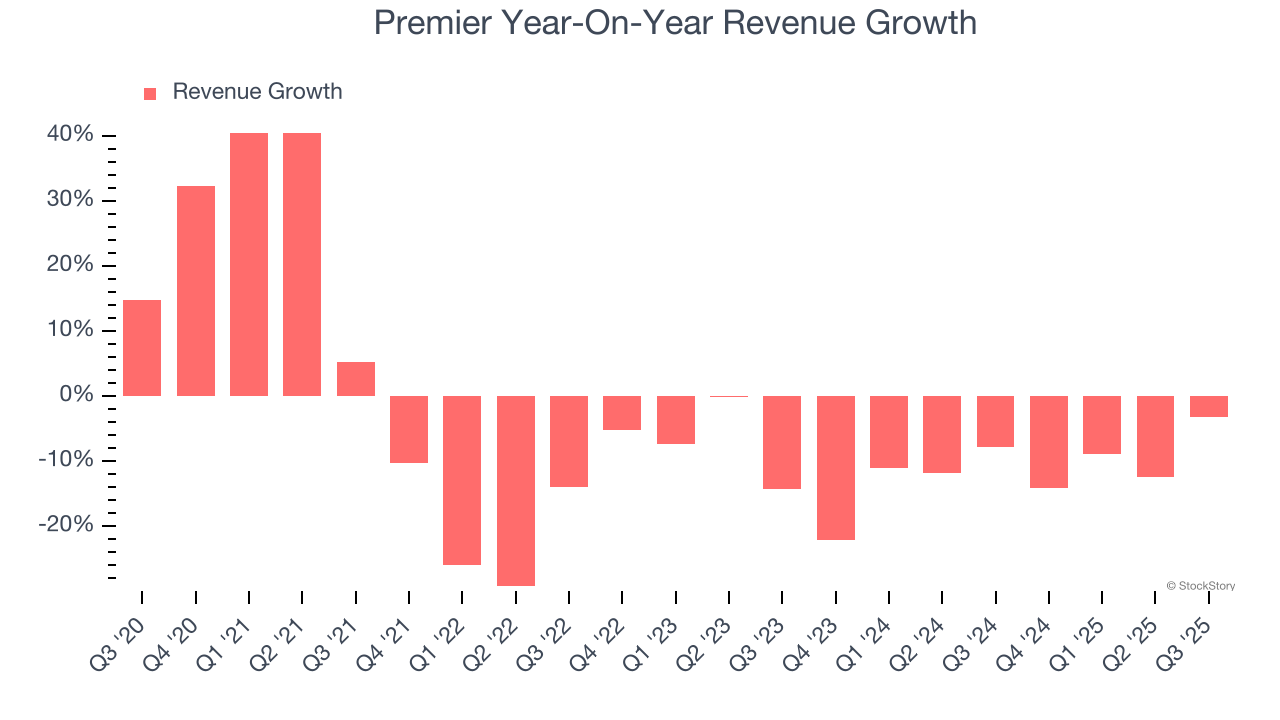
We can better understand the company’s revenue dynamics by analyzing its most important segments, Supply Chain and Performance Service, which are 63.4% and 36.6% of revenue. Over the last two years, Premier’s Supply Chain revenue averaged 12.6% year-on-year declines while its Performance Service revenue averaged 8.3% declines. 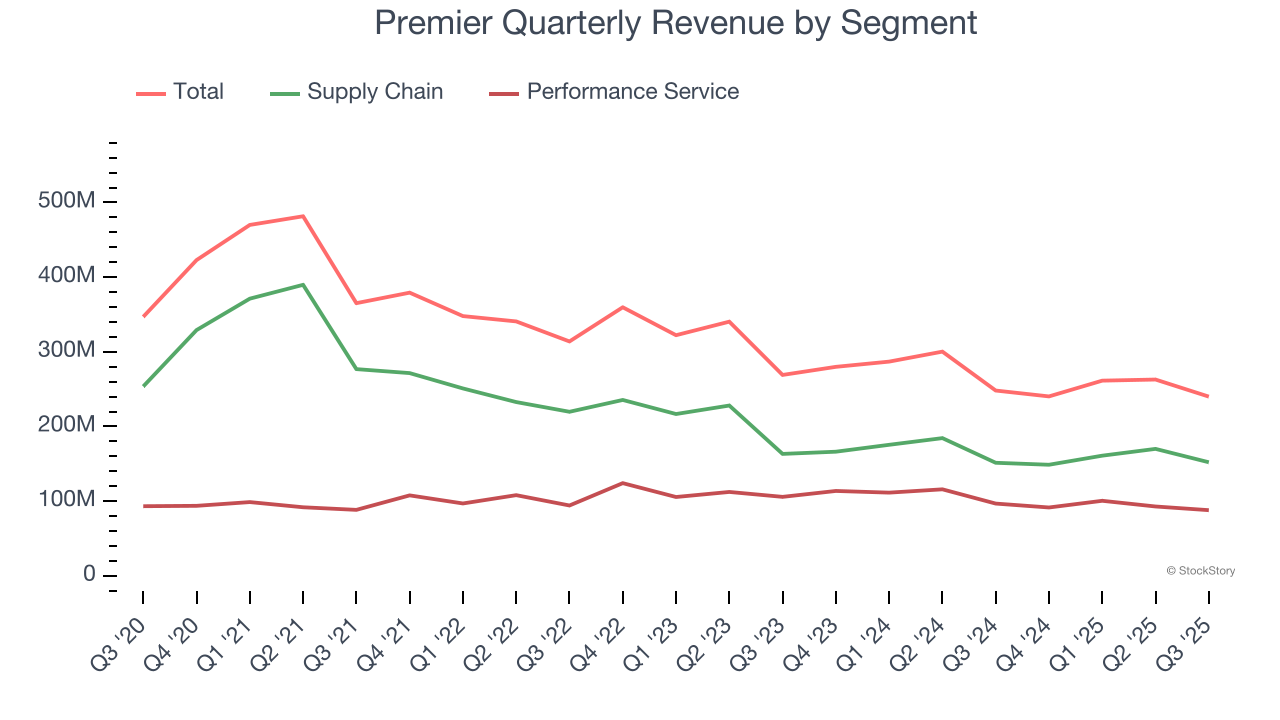
This quarter, Premier missed Wall Street’s estimates and reported a rather uninspiring 3.3% year-on-year revenue decline, generating $240 million of revenue.
Looking ahead, sell-side analysts expect revenue to decline by 2% over the next 12 months. While this projection is better than its two-year trend, it’s tough to feel optimistic about a company facing demand difficulties.
While Wall Street chases Nvidia at all-time highs, an under-the-radar semiconductor supplier is dominating a critical AI component these giants can’t build without. Click here to access our free report one of our favorites growth stories.
Operating Margin
Premier has done a decent job managing its cost base over the last five years. The company has produced an average operating margin of 13.1%, higher than the broader healthcare sector.
Analyzing the trend in its profitability, Premier’s operating margin decreased by 16.6 percentage points over the last five years. This performance was caused by more recent speed bumps as the company’s margin fell by 19.7 percentage points on a two-year basis. We’re disappointed in these results because it shows its expenses were rising and it couldn’t pass those costs onto its customers.
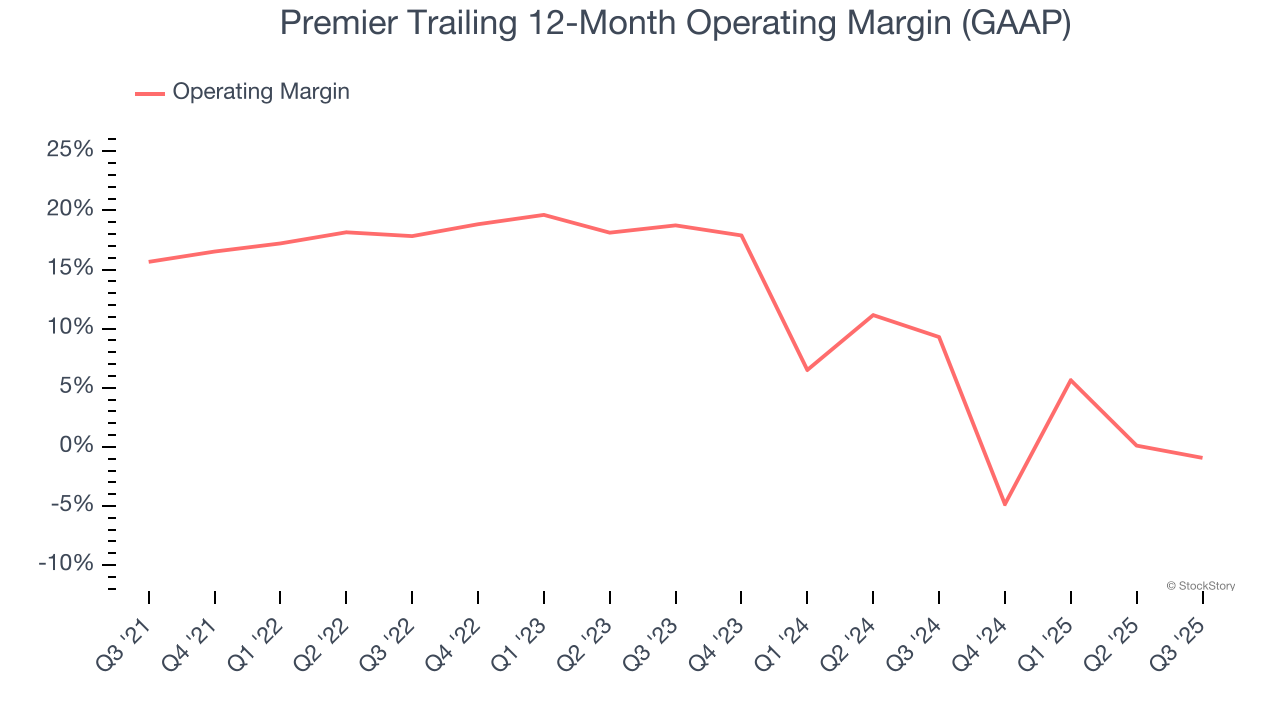
This quarter, Premier generated an operating margin profit margin of 10.4%, down 3.9 percentage points year on year. This contraction shows it was less efficient because its expenses increased relative to its revenue.
Earnings Per Share
Revenue trends explain a company’s historical growth, but the long-term change in earnings per share (EPS) points to the profitability of that growth – for example, a company could inflate its sales through excessive spending on advertising and promotions.
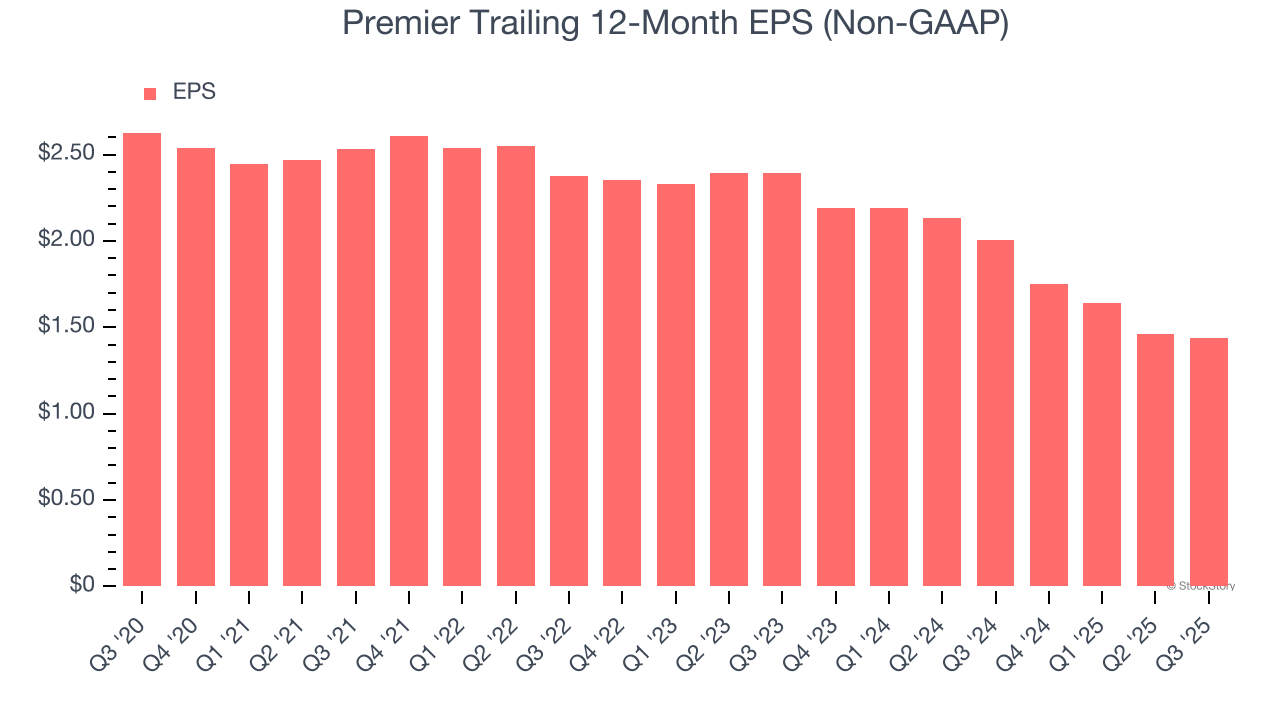
Sadly for Premier, its EPS declined by 11.3% annually over the last five years, more than its revenue. This tells us the company struggled because its fixed cost base made it difficult to adjust to shrinking demand.
Diving into the nuances of Premier’s earnings can give us a better understanding of its performance. As we mentioned earlier, Premier’s operating margin declined by 16.6 percentage points over the last five years. This was the most relevant factor (aside from the revenue impact) behind its lower earnings; interest expenses and taxes can also affect EPS but don’t tell us as much about a company’s fundamentals.
In Q3, Premier reported adjusted EPS of $0.32, down from $0.34 in the same quarter last year. Despite falling year on year, this print easily cleared analysts’ estimates. Over the next 12 months, Wall Street expects Premier’s full-year EPS of $1.44 to grow 3.8%.
Key Takeaways from Premier’s Q3 Results
It was good to see Premier beat analysts’ EPS expectations this quarter. On the other hand, its revenue slightly missed. Zooming out, we think this was a mixed quarter. The company previously announced it will be acquired by Patient Square Capital. As a result of the pending acquisition, Premier is withdrawing previously issued, and is no longer providing, fiscal-year 2026 guidance. The stock remained flat at $28.19 immediately following the results.
Is Premier an attractive investment opportunity at the current price? What happened in the latest quarter matters, but not as much as longer-term business quality and valuation, when deciding whether to invest in this stock. We cover that in our actionable full research report which you can read here, it’s free for active Edge members.


