
Specialty pharmaceutical company Supernus Pharmaceuticals (NASDAQ: SUPN) reported Q3 CY2025 results exceeding the market’s revenue expectations, with sales up 9.3% year on year to $192.1 million. On the other hand, the company’s full-year revenue guidance of $695 million at the midpoint came in 1.1% below analysts’ estimates. Its GAAP profit of $0.80 per share was significantly above analysts’ consensus estimates.
Is now the time to buy Supernus Pharmaceuticals? Find out by accessing our full research report, it’s free for active Edge members.
Supernus Pharmaceuticals (SUPN) Q3 CY2025 Highlights:
- Revenue: $192.1 million vs analyst estimates of $182.1 million (9.3% year-on-year growth, 5.5% beat)
- EPS (GAAP): $0.80 vs analyst estimates of -$0.93 (significant beat)
- Adjusted EBITDA: -$35.88 million vs analyst estimates of $20 million (-18.7% margin, significant miss)
- The company lifted its revenue guidance for the full year to $695 million at the midpoint from $685 million, a 1.5% increase
- Operating Margin: -31.4%, down from 23.2% in the same quarter last year
- Market Capitalization: $3.12 billion
"Our strong operating results continued into the third quarter of 2025, reflecting continued momentum from Qelbree and GOCOVRI, collaboration revenue from ZURZUVAE, and an encouraging start to the launch of ONAPGO,” said Jack Khattar, President and CEO of Supernus.
Company Overview
With a diverse portfolio of eight FDA-approved medications targeting neurological conditions, Supernus Pharmaceuticals (NASDAQ: SUPN) develops and markets treatments for central nervous system disorders including epilepsy, ADHD, Parkinson's disease, and migraine.
Revenue Growth
A company’s long-term sales performance is one signal of its overall quality. Any business can put up a good quarter or two, but the best consistently grow over the long haul. Regrettably, Supernus Pharmaceuticals’s sales grew at a mediocre 6.2% compounded annual growth rate over the last five years. This fell short of our benchmark for the healthcare sector and is a tough starting point for our analysis.
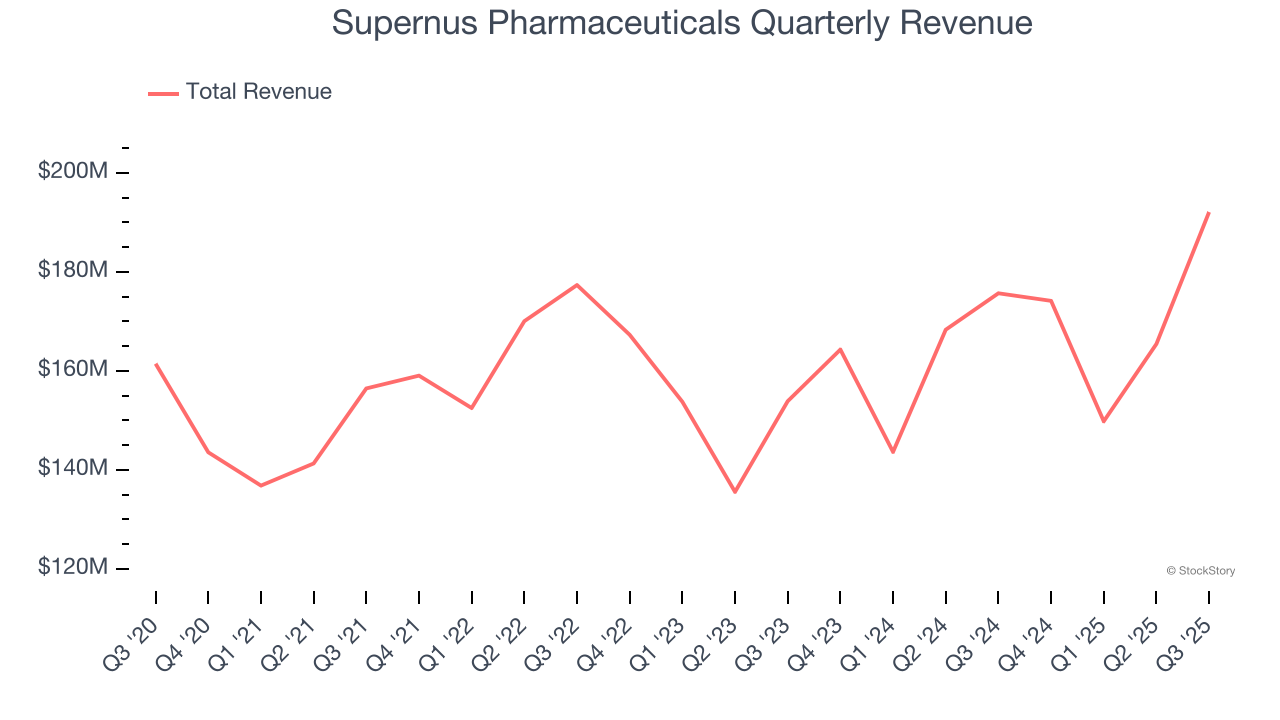
We at StockStory place the most emphasis on long-term growth, but within healthcare, a half-decade historical view may miss recent innovations or disruptive industry trends. Supernus Pharmaceuticals’s annualized revenue growth of 5.7% over the last two years aligns with its five-year trend, suggesting its demand was consistently weak. 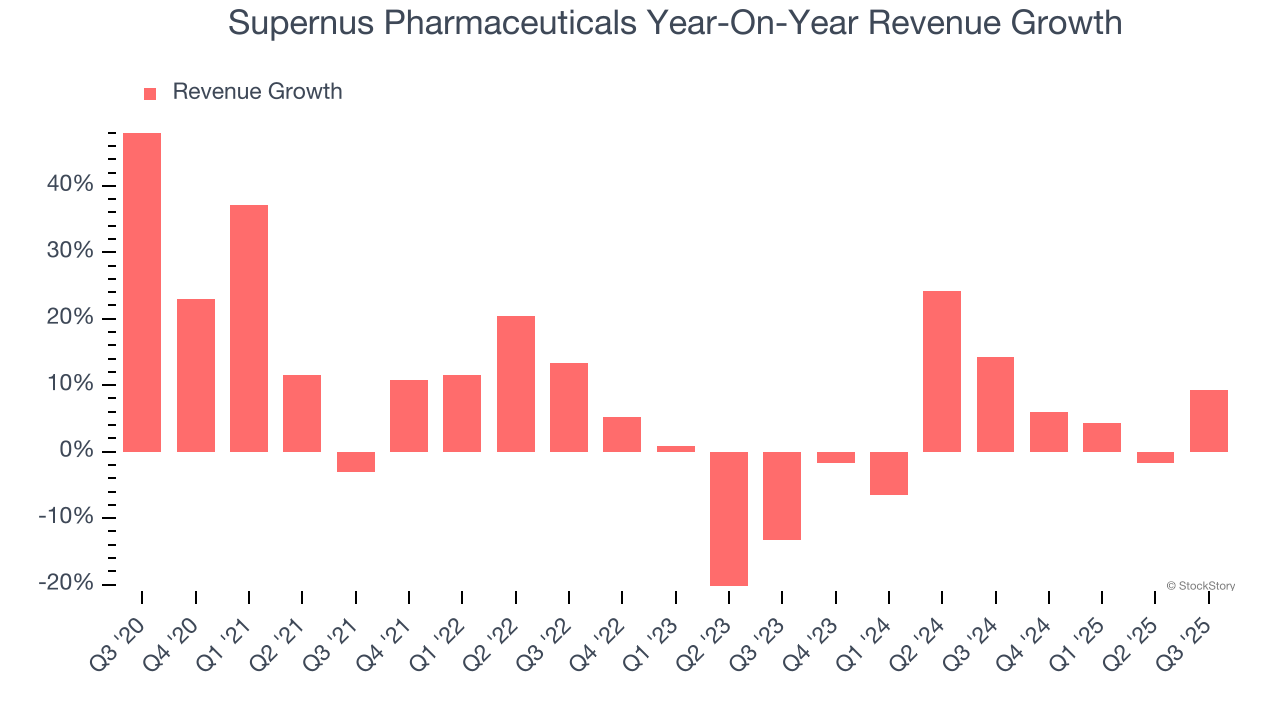
This quarter, Supernus Pharmaceuticals reported year-on-year revenue growth of 9.3%, and its $192.1 million of revenue exceeded Wall Street’s estimates by 5.5%.
Looking ahead, sell-side analysts expect revenue to grow 22.6% over the next 12 months, an improvement versus the last two years. This projection is eye-popping and suggests its newer products and services will fuel better top-line performance.
Software is eating the world and there is virtually no industry left that has been untouched by it. That drives increasing demand for tools helping software developers do their jobs, whether it be monitoring critical cloud infrastructure, integrating audio and video functionality, or ensuring smooth content streaming. Click here to access a free report on our 3 favorite stocks to play this generational megatrend.
Operating Margin
Operating margin is one of the best measures of profitability because it tells us how much money a company takes home after subtracting all core expenses, like marketing and R&D.
Supernus Pharmaceuticals was profitable over the last five years but held back by its large cost base. Its average operating margin of 6.1% was weak for a healthcare business.
Analyzing the trend in its profitability, Supernus Pharmaceuticals’s operating margin decreased by 26.7 percentage points over the last five years. The company’s two-year trajectory also shows it failed to get its profitability back to the peak as its margin fell by 10.3 percentage points. This performance was poor no matter how you look at it - it shows its expenses were rising and it couldn’t pass those costs onto its customers.
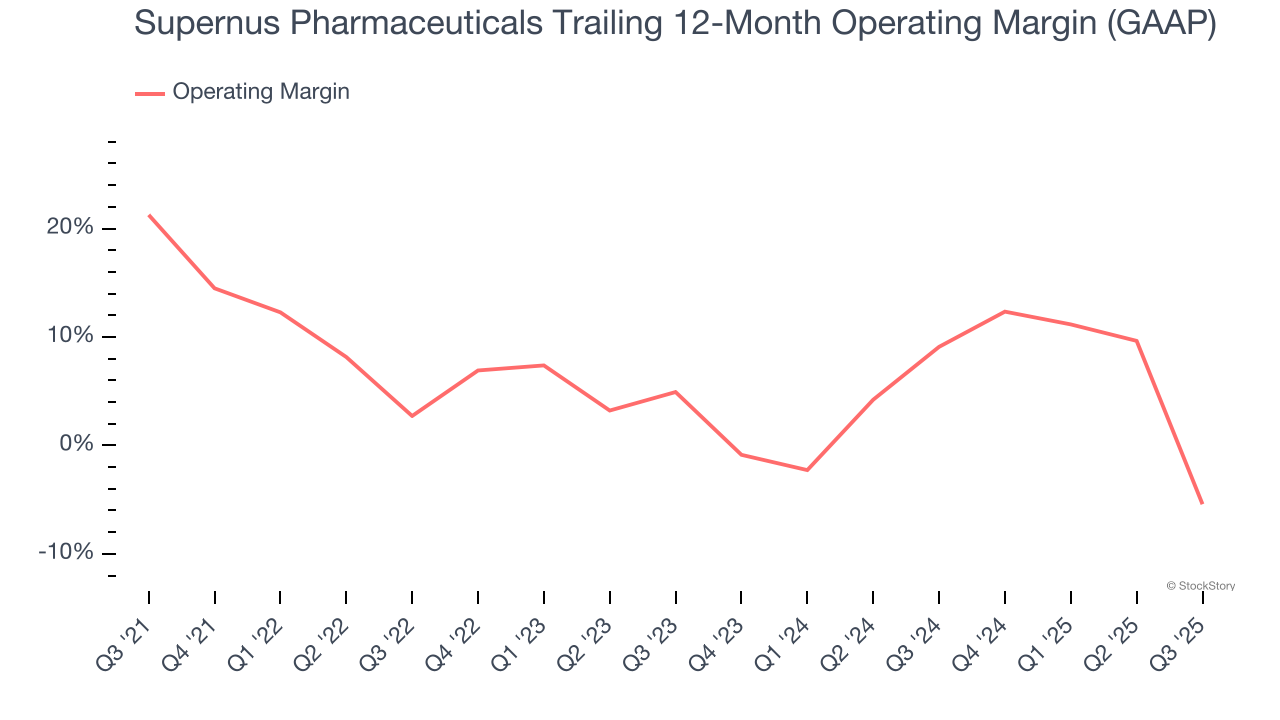
This quarter, Supernus Pharmaceuticals generated an operating margin profit margin of negative 31.4%, down 54.6 percentage points year on year. This contraction shows it was less efficient because its expenses grew faster than its revenue.
Earnings Per Share
We track the long-term change in earnings per share (EPS) for the same reason as long-term revenue growth. Compared to revenue, however, EPS highlights whether a company’s growth is profitable.
Sadly for Supernus Pharmaceuticals, its EPS declined by 12.2% annually over the last five years while its revenue grew by 6.2%. This tells us the company became less profitable on a per-share basis as it expanded.
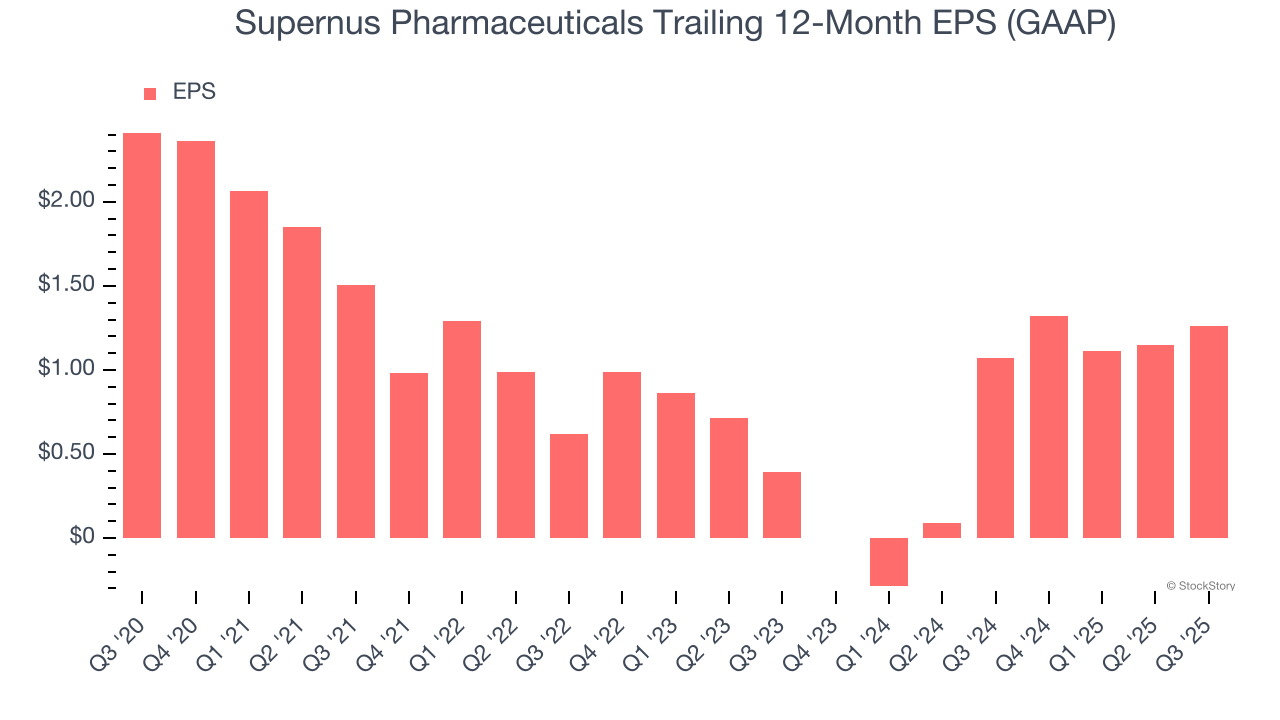
Diving into the nuances of Supernus Pharmaceuticals’s earnings can give us a better understanding of its performance. As we mentioned earlier, Supernus Pharmaceuticals’s operating margin declined by 26.7 percentage points over the last five years. Its share count also grew by 5.2%, meaning the company not only became less efficient with its operating expenses but also diluted its shareholders. 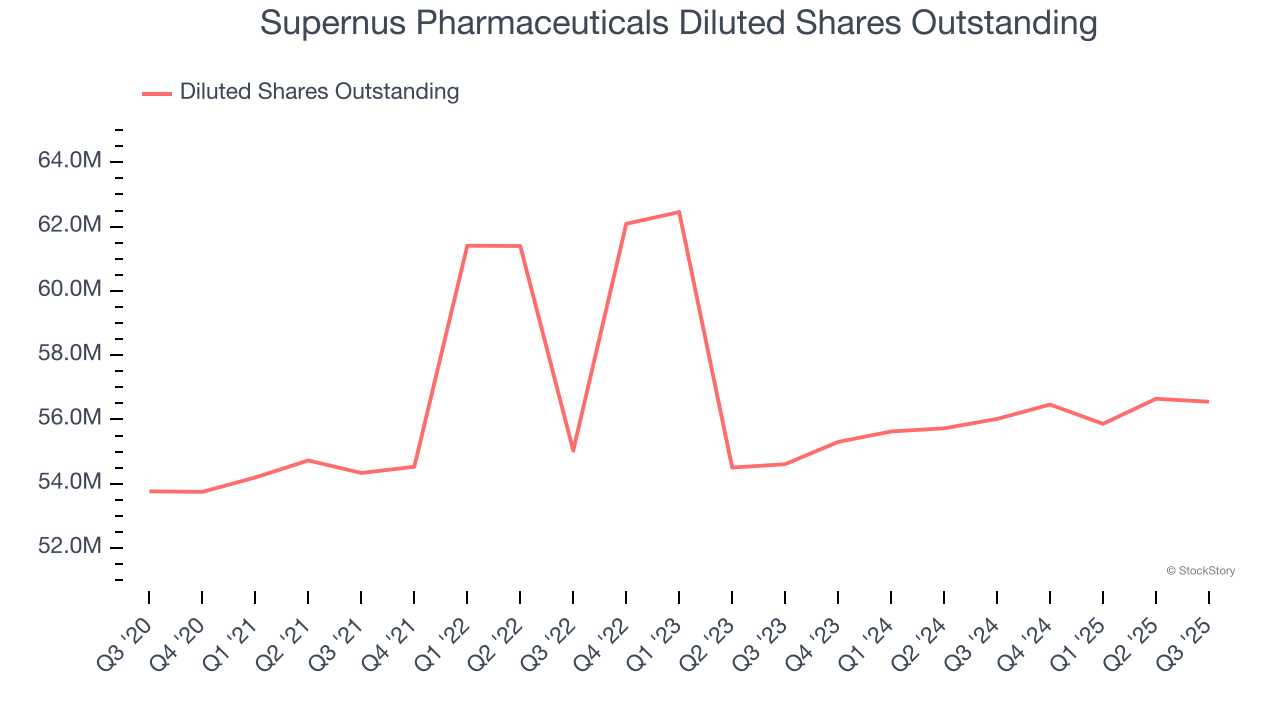
In Q3, Supernus Pharmaceuticals reported EPS of $0.80, up from $0.69 in the same quarter last year. This print easily cleared analysts’ estimates, and shareholders should be content with the results. Over the next 12 months, Wall Street expects Supernus Pharmaceuticals’s full-year EPS of $1.26 to shrink by 67.3%.
Key Takeaways from Supernus Pharmaceuticals’s Q3 Results
It was good to see Supernus Pharmaceuticals beat analysts’ EPS expectations this quarter. We were also excited its revenue outperformed Wall Street’s estimates by a wide margin. On the other hand, its full-year revenue guidance slightly missed. Overall, we think this was a decent quarter with some key metrics above expectations. The stock remained flat at $57 immediately following the results.
Is Supernus Pharmaceuticals an attractive investment opportunity right now? What happened in the latest quarter matters, but not as much as longer-term business quality and valuation, when deciding whether to invest in this stock. We cover that in our actionable full research report which you can read here, it’s free for active Edge members.