
Cash management services provider Brink's (NYSE: BCO) met Wall Streets revenue expectations in Q3 CY2025, with sales up 6.1% year on year to $1.34 billion. The company expects next quarter’s revenue to be around $1.36 billion, coming in 0.5% above analysts’ estimates. Its non-GAAP profit of $2.08 per share was in line with analysts’ consensus estimates.
Is now the time to buy Brink's? Find out by accessing our full research report, it’s free for active Edge members.
Brink's (BCO) Q3 CY2025 Highlights:
- Revenue: $1.34 billion vs analyst estimates of $1.33 billion (6.1% year-on-year growth, in line)
- Adjusted EPS: $2.08 vs analyst estimates of $2.08 (in line)
- Adjusted EBITDA: $253.3 million vs analyst estimates of $251.7 million (19% margin, 0.6% beat)
- Revenue Guidance for Q4 CY2025 is $1.36 billion at the midpoint, roughly in line with what analysts were expecting
- Adjusted EPS guidance for Q4 CY2025 is $2.48 at the midpoint, roughly in line with what analysts were expecting
- EBITDA guidance for Q4 CY2025 is $277 million at the midpoint, in line with analyst expectations
- Operating Margin: 11.4%, up from 9.3% in the same quarter last year
- Free Cash Flow Margin: 5.8%, up from 0.6% in the same quarter last year
- Market Capitalization: $4.41 billion
Mark Eubanks, president and CEO, said: “We delivered a strong third quarter, above the midpoint of our previous guidance range. In line with our expectations, AMS and DRS growth accelerated quarter-over-quarter to 19% on customer conversions and healthy new additions to our portfolio. Our efforts to transform the business with the Brink's Business System are driving margin expansion with record third-quarter operating profit and EBITDA margins. We continue to improve cash generation, delivering a 30% increase to free cash flow year-over-year driven by improved profitability, improved working capital metrics, and lowered capex intensity. We remain committed to our capital allocation framework, lowering our leverage below three times and reducing our outstanding share count by 5% year-to-date, while making key investments in strategic acquisitions."
Company Overview
Known for its iconic armored trucks that have been a fixture in American cities since 1859, Brink's (NYSE: BCO) provides secure transportation and management of cash and valuables for banks, retailers, and other businesses worldwide.
Revenue Growth
A company’s long-term sales performance is one signal of its overall quality. Any business can have short-term success, but a top-tier one grows for years.
With $5.15 billion in revenue over the past 12 months, Brink's is one of the larger companies in the business services industry and benefits from a well-known brand that influences purchasing decisions.
As you can see below, Brink’s 7.4% annualized revenue growth over the last five years was solid. This shows it had high demand, a useful starting point for our analysis.
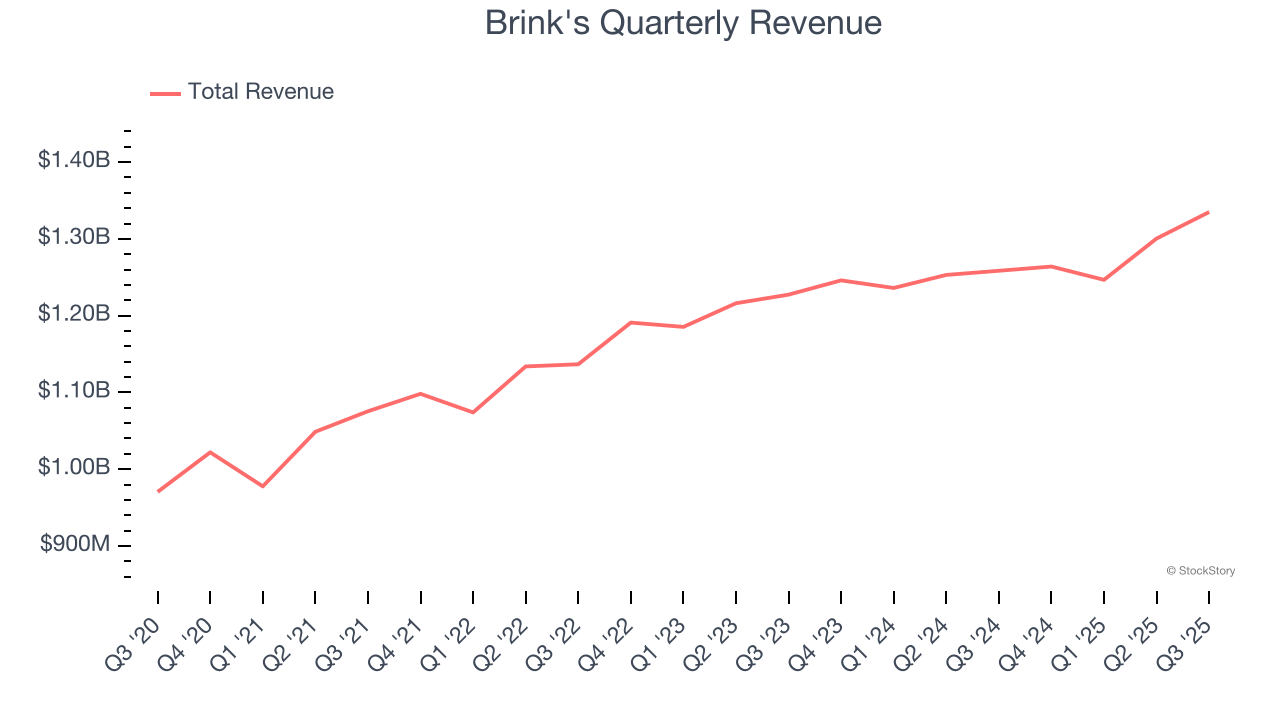
Long-term growth is the most important, but within business services, a half-decade historical view may miss new innovations or demand cycles. Brink’s recent performance shows its demand has slowed as its annualized revenue growth of 3.3% over the last two years was below its five-year trend. 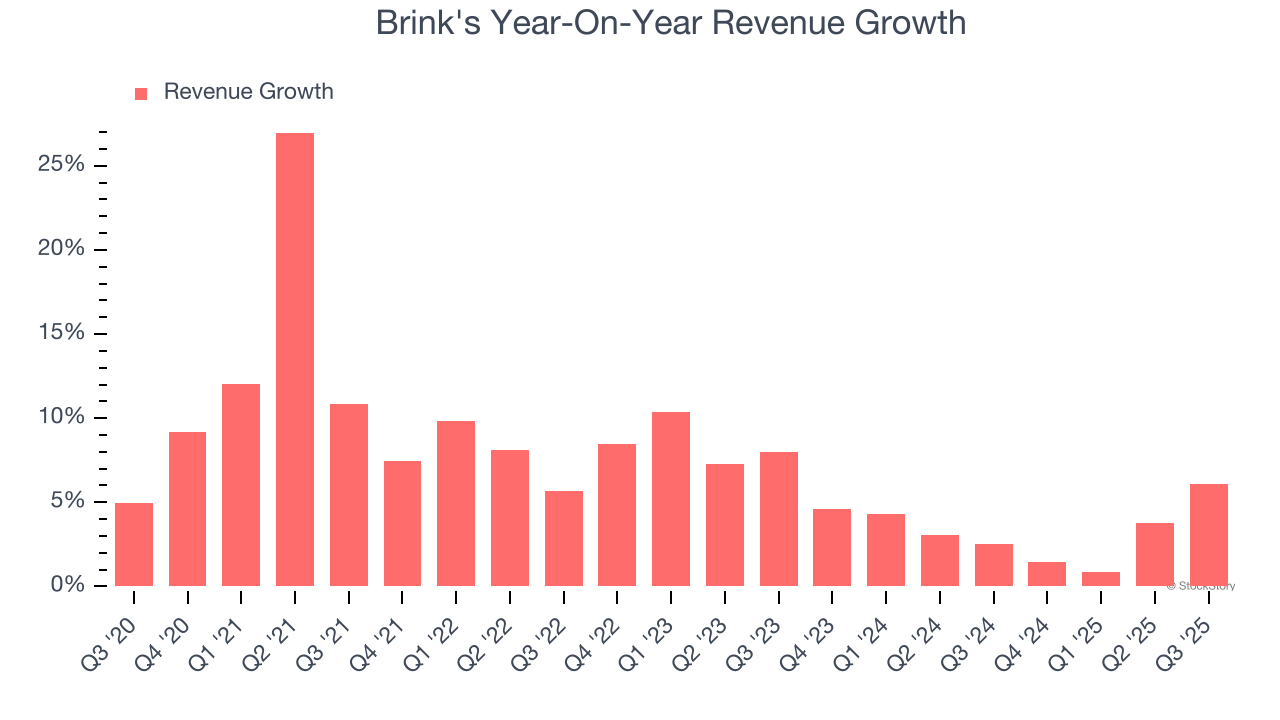
This quarter, Brink's grew its revenue by 6.1% year on year, and its $1.34 billion of revenue was in line with Wall Street’s estimates. Company management is currently guiding for a 7.2% year-on-year increase in sales next quarter.
Looking further ahead, sell-side analysts expect revenue to grow 5.2% over the next 12 months, an improvement versus the last two years. This projection is above the sector average and suggests its newer products and services will fuel better top-line performance.
Software is eating the world and there is virtually no industry left that has been untouched by it. That drives increasing demand for tools helping software developers do their jobs, whether it be monitoring critical cloud infrastructure, integrating audio and video functionality, or ensuring smooth content streaming. Click here to access a free report on our 3 favorite stocks to play this generational megatrend.
Operating Margin
Brink's was profitable over the last five years but held back by its large cost base. Its average operating margin of 9.2% was weak for a business services business.
On the plus side, Brink’s operating margin rose by 4.9 percentage points over the last five years, as its sales growth gave it operating leverage.
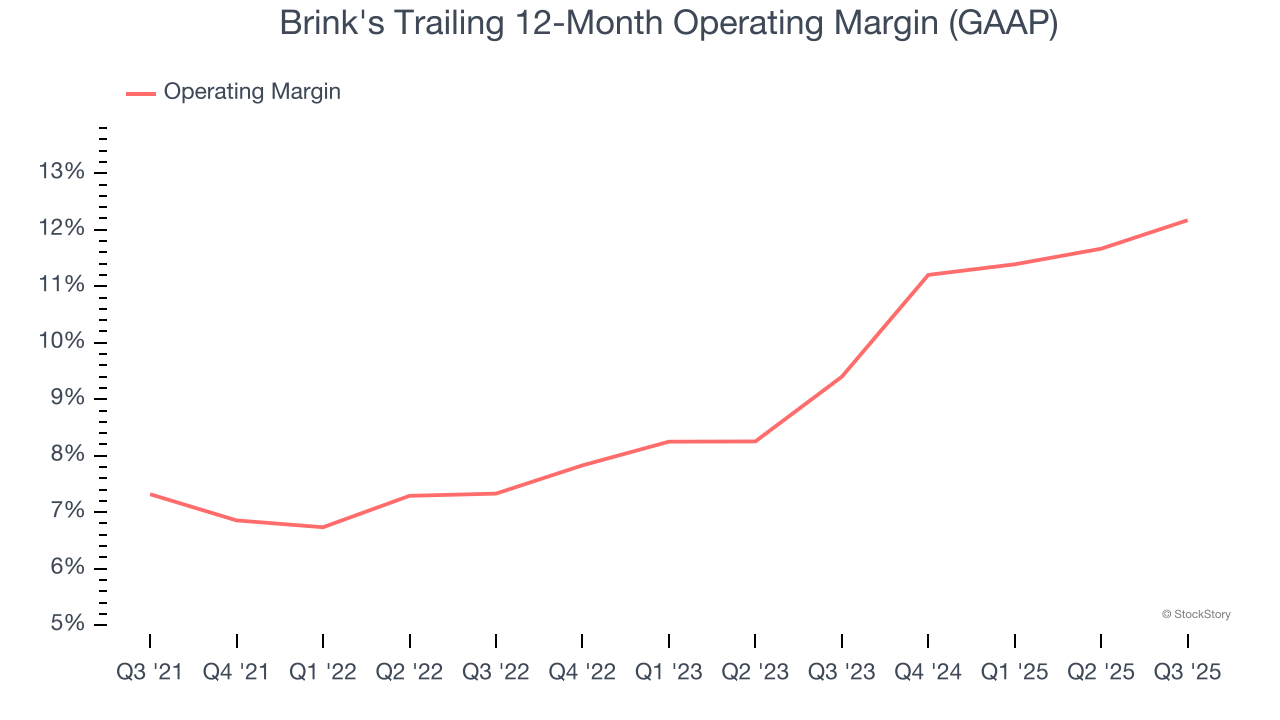
In Q3, Brink's generated an operating margin profit margin of 11.4%, up 2.1 percentage points year on year. This increase was a welcome development and shows it was more efficient.
Earnings Per Share
We track the long-term change in earnings per share (EPS) for the same reason as long-term revenue growth. Compared to revenue, however, EPS highlights whether a company’s growth is profitable.
Brink’s EPS grew at an astounding 19.9% compounded annual growth rate over the last five years, higher than its 7.4% annualized revenue growth. This tells us the company became more profitable on a per-share basis as it expanded.
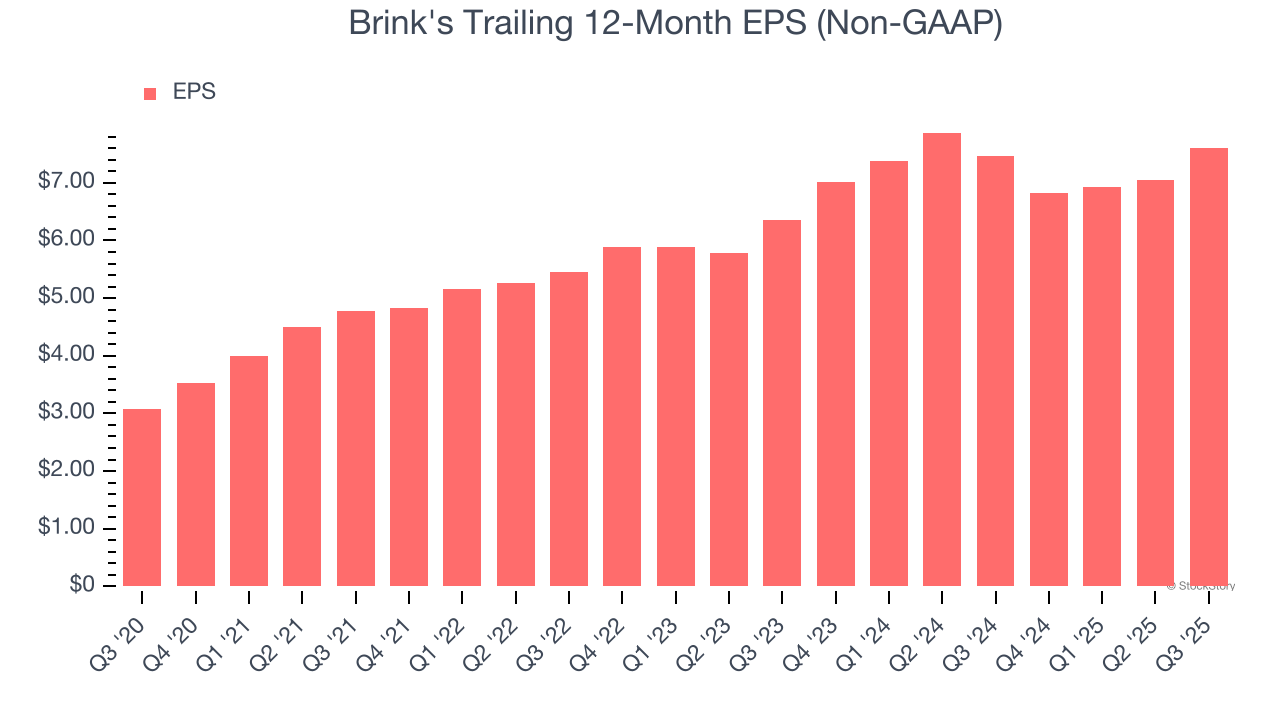
We can take a deeper look into Brink’s earnings quality to better understand the drivers of its performance. As we mentioned earlier, Brink’s operating margin expanded by 4.9 percentage points over the last five years. On top of that, its share count shrank by 16.9%. These are positive signs for shareholders because improving profitability and share buybacks turbocharge EPS growth relative to revenue growth. 
Like with revenue, we analyze EPS over a shorter period to see if we are missing a change in the business.
For Brink's, its two-year annual EPS growth of 9.4% was lower than its five-year trend. We hope its growth can accelerate in the future.
In Q3, Brink's reported adjusted EPS of $2.08, up from $1.51 in the same quarter last year. This print was close to analysts’ estimates. Over the next 12 months, Wall Street expects Brink’s full-year EPS of $7.61 to grow 16.2%.
Key Takeaways from Brink’s Q3 Results
It was good to see Brink's provide revenue guidance for next quarter that slightly beat analysts’ expectations.Zooming out, we think this was a decent quarter. The stock remained flat at $105.88 immediately following the results.
Big picture, is Brink's a buy here and now? What happened in the latest quarter matters, but not as much as longer-term business quality and valuation, when deciding whether to invest in this stock. We cover that in our actionable full research report which you can read here, it’s free for active Edge members.


