
Payment technology company Crane NXT (NYSE: CXT) reported revenue ahead of Wall Streets expectations in Q3 CY2025, with sales up 10.3% year on year to $445.1 million. Its non-GAAP profit of $1.28 per share was 1.8% above analysts’ consensus estimates.
Is now the time to buy Crane NXT? Find out by accessing our full research report, it’s free for active Edge members.
Crane NXT (CXT) Q3 CY2025 Highlights:
- Revenue: $445.1 million vs analyst estimates of $429.8 million (10.3% year-on-year growth, 3.6% beat)
- Adjusted EPS: $1.28 vs analyst estimates of $1.26 (1.8% beat)
- Adjusted EBITDA: $122.4 million vs analyst estimates of $117.7 million (27.5% margin, 4% beat)
- Management lowered its full-year Adjusted EPS guidance to $4.05 at the midpoint, a 2.4% decrease
- Operating Margin: 18.4%, in line with the same quarter last year
- Free Cash Flow Margin: 17.7%, up from 14.6% in the same quarter last year
- Backlog: $557 million at quarter end
- Market Capitalization: $3.62 billion
Aaron W. Saak, Crane NXT's President and Chief Executive Officer, stated: "Our third quarter results continue to show progress in the evolution of Crane NXT, with accelerating growth in our SAT segment, strong margins in CPI, and robust free cash flow. Given the sustained momentum in SAT, we are raising our full year sales guidance. Additionally, we are narrowing our Adjusted EPS guidance range primarily driven by ongoing macroeconomic uncertainty impacting demand in CPI."
Company Overview
Born from a corporate transformation completed in 2023, Crane NXT (NYSE: CXT) provides specialized technology solutions for payment processing, banknote security, and authentication systems for financial institutions and businesses.
Revenue Growth
A company’s top-line performance is one signal of its overall business quality. Strong growth can indicate it’s riding a successful new product or emerging trend.
With $1.58 billion in revenue over the past 12 months, Crane NXT is a small player in the business services space, which sometimes brings disadvantages compared to larger competitors benefiting from economies of scale and numerous distribution channels.
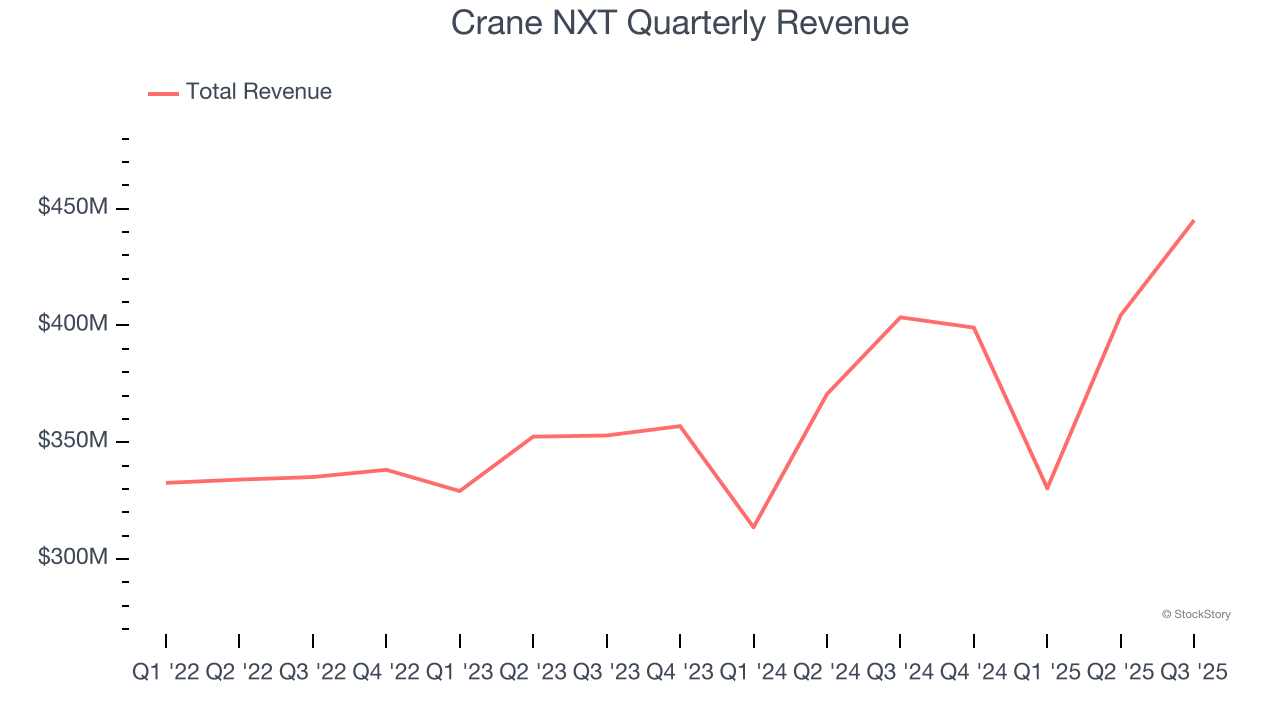
This quarter, Crane NXT reported year-on-year revenue growth of 10.3%, and its $445.1 million of revenue exceeded Wall Street’s estimates by 3.6%.
Looking ahead, sell-side analysts expect revenue to grow 8.5% over the next 12 months, similar to its two-year rate. This projection is commendable and indicates its newer products and services will catalyze better top-line performance.
The 1999 book Gorilla Game predicted Microsoft and Apple would dominate tech before it happened. Its thesis? Identify the platform winners early. Today, enterprise software companies embedding generative AI are becoming the new gorillas. a profitable, fast-growing enterprise software stock that is already riding the automation wave and looking to catch the generative AI next.
Operating Margin
Crane NXT has been a well-oiled machine over the last four years. It demonstrated elite profitability for a business services business, boasting an average operating margin of 19%.
Looking at the trend in its profitability, Crane NXT’s operating margin decreased by 8.6 percentage points over the last four years. Even though its historical margin was healthy, shareholders will want to see Crane NXT become more profitable in the future.
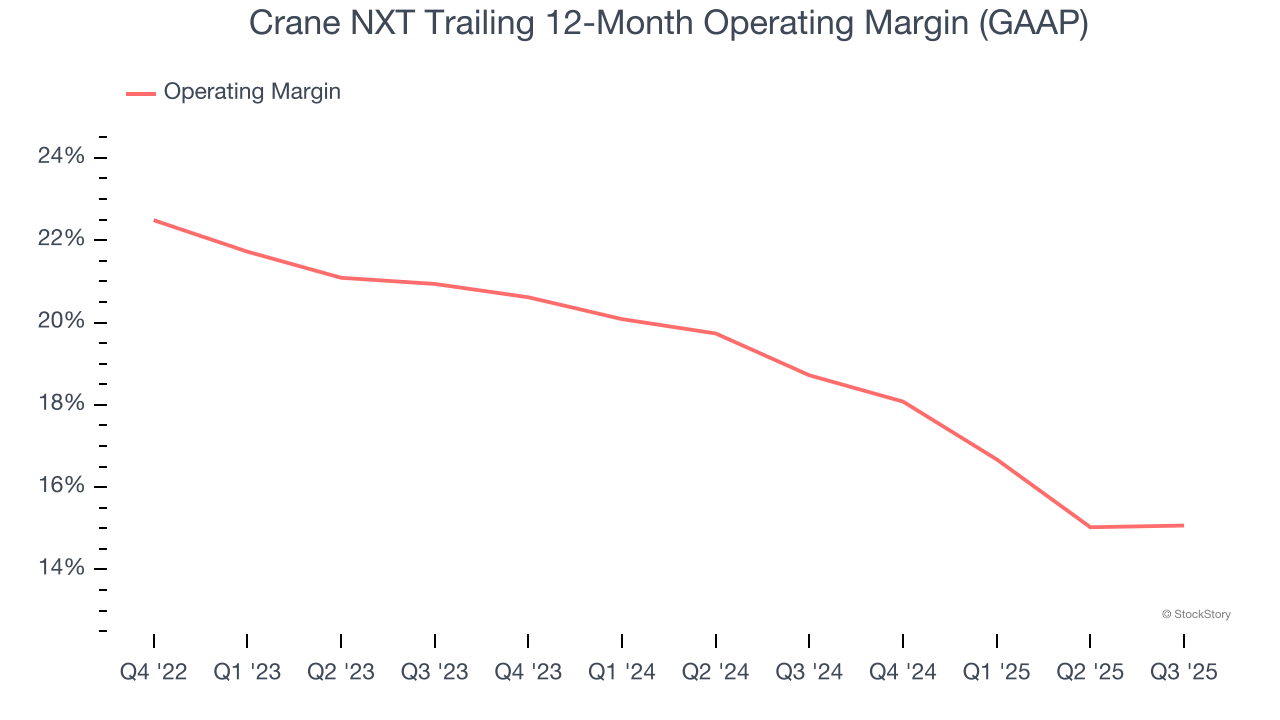
In Q3, Crane NXT generated an operating margin profit margin of 18.4%, in line with the same quarter last year. This indicates the company’s overall cost structure has been relatively stable.
Cash Is King
If you’ve followed StockStory for a while, you know we emphasize free cash flow. Why, you ask? We believe that in the end, cash is king, and you can’t use accounting profits to pay the bills.
Crane NXT has shown terrific cash profitability, enabling it to reinvest, return capital to investors, and stay ahead of the competition while maintaining an ample cushion. The company’s free cash flow margin was among the best in the business services sector, averaging 15.8% over the last four years.
Taking a step back, we can see that Crane NXT’s margin dropped by 12 percentage points during that time. If its declines continue, it could signal increasing investment needs and capital intensity.
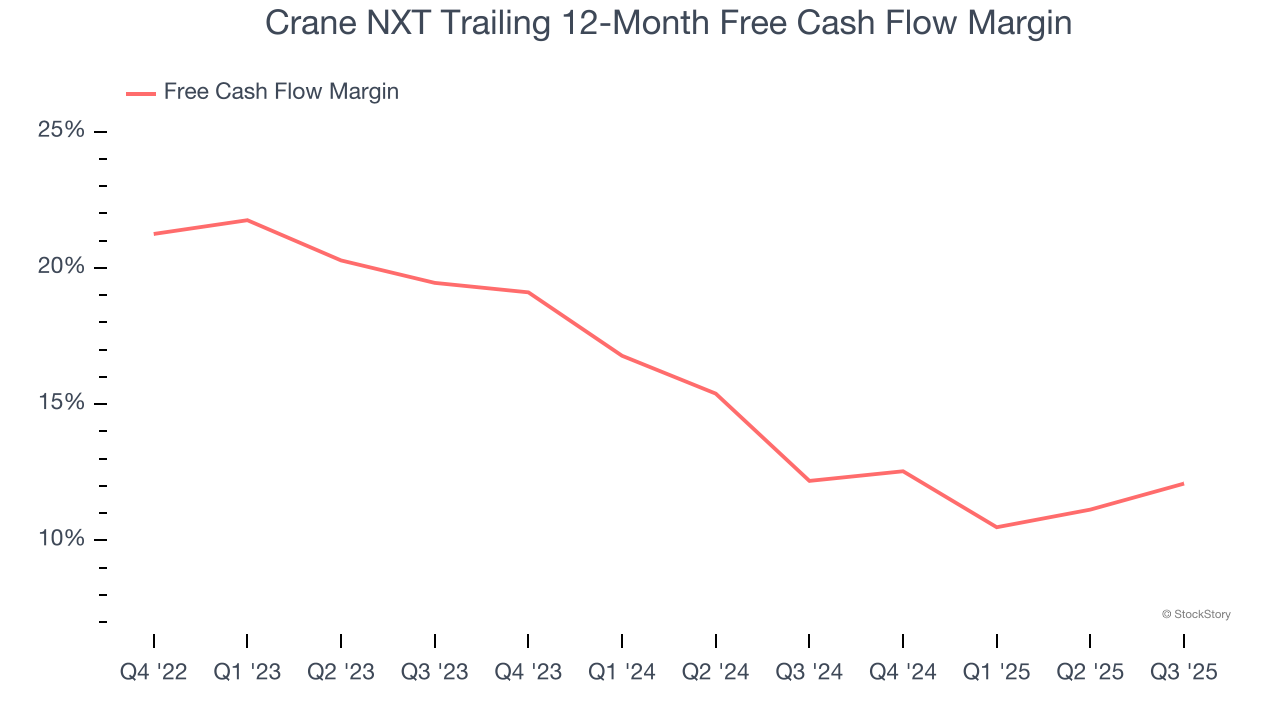
Crane NXT’s free cash flow clocked in at $78.7 million in Q3, equivalent to a 17.7% margin. This result was good as its margin was 3.1 percentage points higher than in the same quarter last year, but we wouldn’t read too much into the short term because investment needs can be seasonal, leading to temporary swings. Long-term trends trump fluctuations.
Key Takeaways from Crane NXT’s Q3 Results
We enjoyed seeing Crane NXT beat analysts’ revenue expectations this quarter. We were also glad its EPS outperformed Wall Street’s estimates. On the other hand, its full-year EPS guidance slightly missed. Zooming out, we think this was a mixed quarter. The stock remained flat at $64.20 immediately following the results.
Should you buy the stock or not? When making that decision, it’s important to consider its valuation, business qualities, as well as what has happened in the latest quarter. We cover that in our actionable full research report which you can read here, it’s free for active Edge members.