
Mortgage insurance provider Enact Holdings (NASDAQ: ACT) met Wall Streets revenue expectations in Q3 CY2025, but sales were flat year on year at $311.5 million. Its non-GAAP profit of $1.12 per share was 1% above analysts’ consensus estimates.
Is now the time to buy Enact Holdings? Find out by accessing our full research report, it’s free for active Edge members.
Enact Holdings (ACT) Q3 CY2025 Highlights:
"Enact continues to execute with discipline and purpose,” stated Rohit Gupta, President and CEO of Enact.
Company Overview
Playing a critical role in helping first-time homebuyers access the housing market, Enact Holdings (NASDAQ: ACT) provides private mortgage insurance that enables lenders to offer home loans with lower down payments while protecting against borrower defaults.
Revenue Growth
Insurance companies generate revenue three ways. The first is the core insurance business itself, represented in the income statement as premiums earned. The second source is investment income from investing the “float” (premiums collected but not yet paid out as claims) in assets such as fixed-income assets and equities. The third is fees from policy administration, annuities, and other value-added services. Over the last five years, Enact Holdings grew its revenue at a sluggish 2.4% compounded annual growth rate. This was below our standards and is a tough starting point for our analysis.
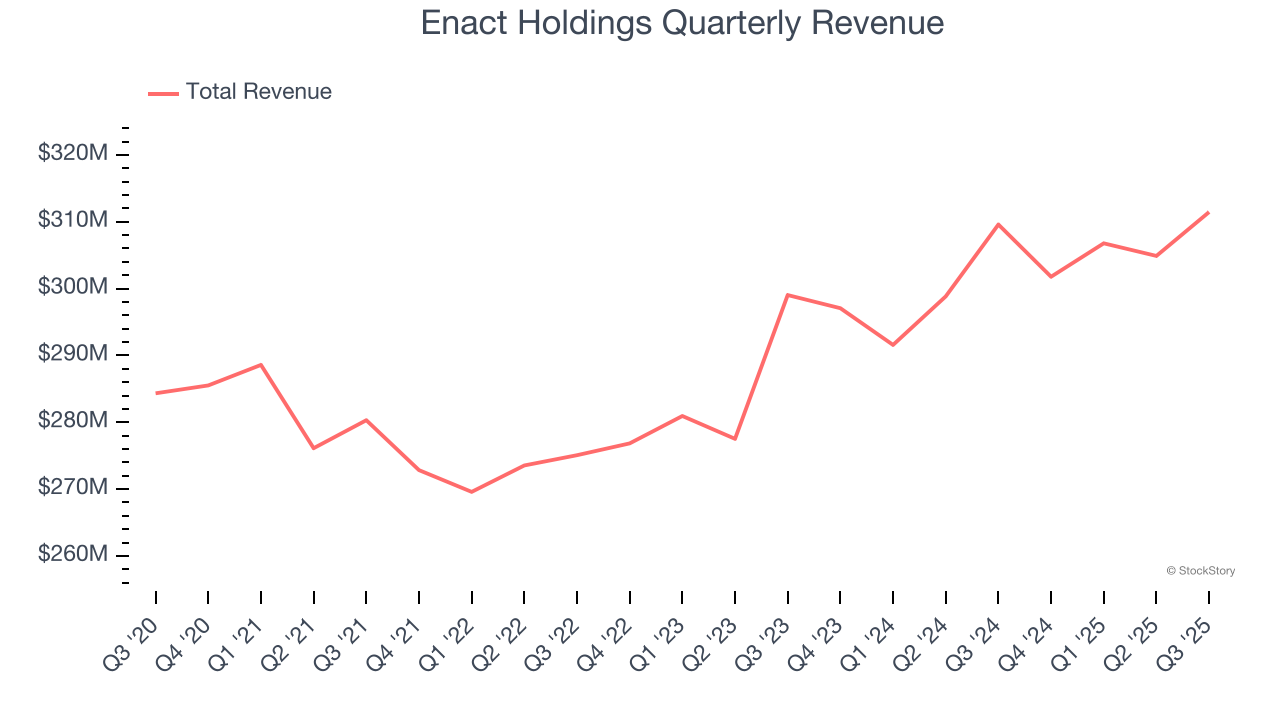
Long-term growth is the most important, but within financials, a half-decade historical view may miss recent interest rate changes and market returns. Enact Holdings’s annualized revenue growth of 3.9% over the last two years is above its five-year trend, but we were still disappointed by the results. 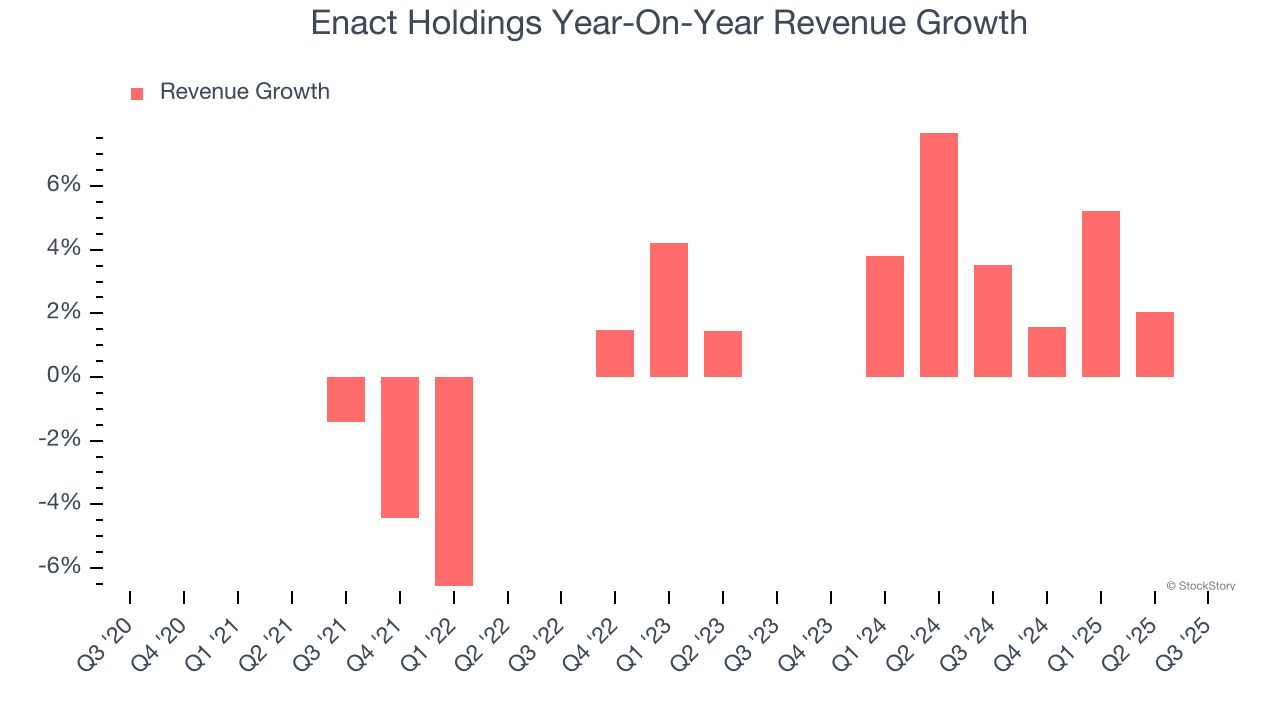 Note: Quarters not shown were determined to be outliers, impacted by outsized investment gains/losses that are not indicative of the recurring fundamentals of the business.
This quarter, Enact Holdings’s $311.5 million of revenue was flat year on year and in line with Wall Street’s estimates.
Net premiums earned made up 83.7% of the company’s total revenue during the last five years, meaning Enact Holdings barely relies on non-insurance activities to drive its overall growth.
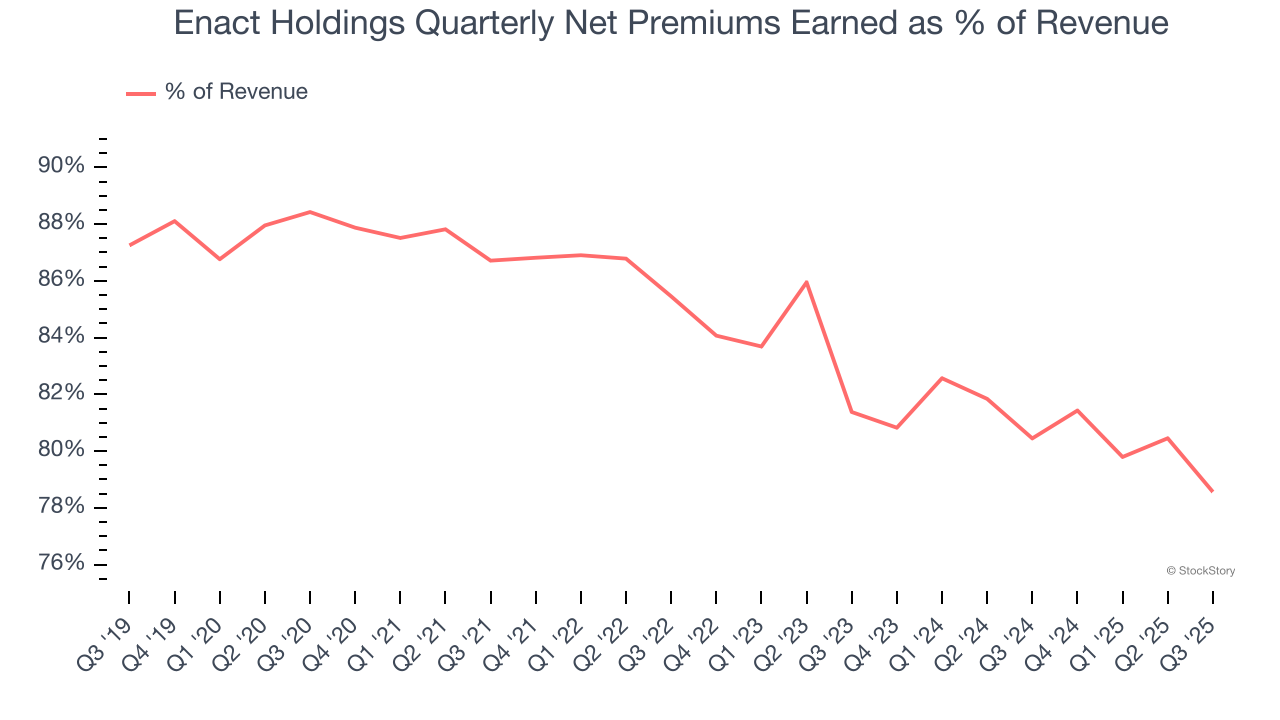
While insurers generate revenue from multiple sources, investors view net premiums earned as the cornerstone - its direct link to core operations stands in sharp contrast to the unpredictability of investment returns and fees.
Microsoft, Alphabet, Coca-Cola, Monster Beverage—all began as under-the-radar growth stories riding a massive trend. We’ve identified the next one: a profitable AI semiconductor play Wall Street is still overlooking. Go here for access to our full report.
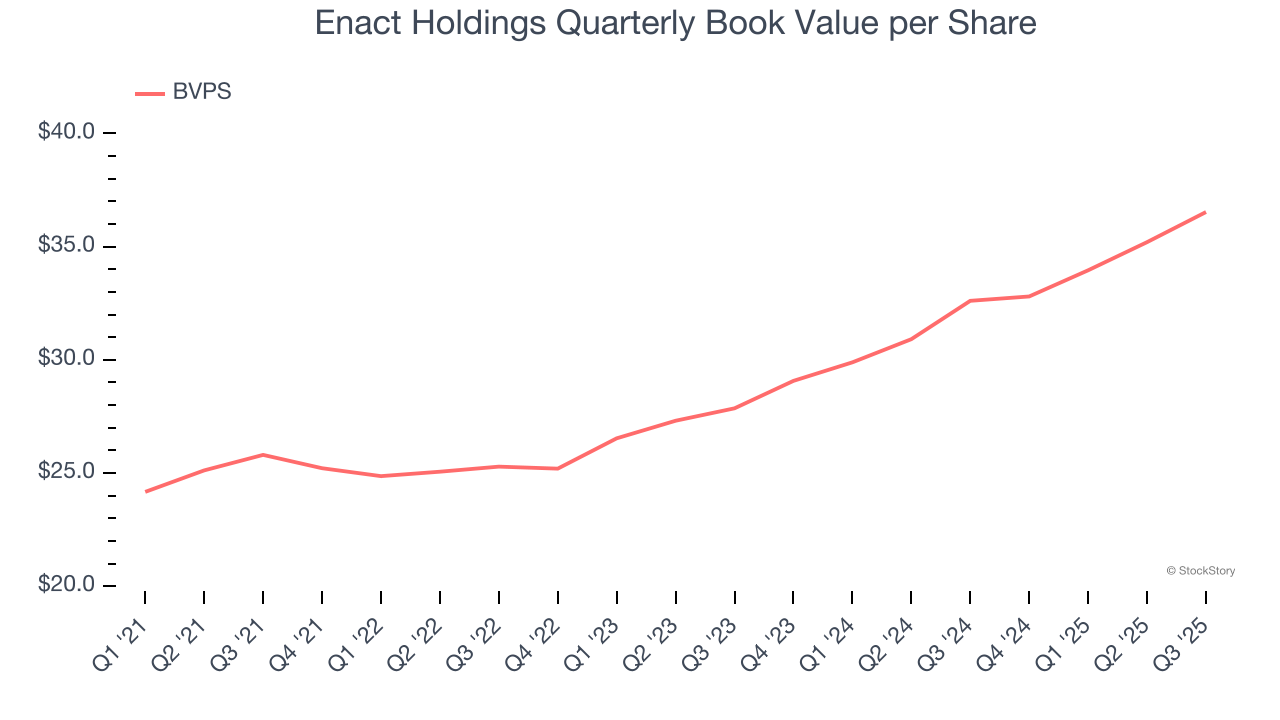
Book Value Per Share (BVPS)
Insurance companies are balance sheet businesses, collecting premiums upfront and paying out claims over time. The float – premiums collected but not yet paid out – are invested, creating an asset base supported by a liability structure. Book value captures this dynamic by measuring:
- Assets (investment portfolio, cash, reinsurance recoverables) - liabilities (claim reserves, debt, future policy benefits)
BVPS is essentially the residual value for shareholders.
We therefore consider BVPS very important to track for insurers and a metric that sheds light on business quality. While other (and more commonly known) per-share metrics like EPS can sometimes be lumpy due to reserve releases or one-time items and can be managed or skewed while still following accounting rules, BVPS reflects long-term capital growth and is harder to manipulate.
Enact Holdings’s BVPS grew at a solid 9.1% annual clip over the last four years. BVPS growth has also accelerated recently, growing by 14.5% annually over the last two years from $27.86 to $36.53 per share.
Key Takeaways from Enact Holdings’s Q3 Results
EPS beat slightly, but other than that, there wasn't much else to get excited about. The stock remained flat at $35.93 immediately following the results.
Big picture, is Enact Holdings a buy here and now? If you’re making that decision, you should consider the bigger picture of valuation, business qualities, as well as the latest earnings. We cover that in our actionable full research report which you can read here, it’s free for active Edge members.