Higher education company Grand Canyon Education (NASDAQ: LOPE) met Wall Streets revenue expectations in Q3 CY2025, with sales up 9.6% year on year to $261.1 million. The company expects next quarter’s revenue to be around $307.5 million, close to analysts’ estimates. Its GAAP profit of $0.58 per share was 66.3% below analysts’ consensus estimates.
Is now the time to buy Grand Canyon Education? Find out by accessing our full research report, it’s free for active Edge members.
Grand Canyon Education (LOPE) Q3 CY2025 Highlights:
- Revenue: $261.1 million vs analyst estimates of $259.9 million (9.6% year-on-year growth, in line)
- EPS (GAAP): $0.58 vs analyst expectations of $1.72 (66.3% miss)
- Adjusted EBITDA: $75.9 million vs analyst estimates of $71.6 million (29.1% margin, 6% beat)
- Revenue Guidance for Q4 CY2025 is $307.5 million at the midpoint, roughly in line with what analysts were expecting
- EPS (GAAP) guidance for the full year is $7.72 at the midpoint, missing analyst estimates by 12.8%
- Operating Margin: 6.9%, down from 20.2% in the same quarter last year
- Free Cash Flow was -$58.3 million compared to -$38.95 million in the same quarter last year
- Students: 132,486, up 4,509 year on year
- Market Capitalization: $5.13 billion
Company Overview
Founded in 1949, Grand Canyon Education (NASDAQ: LOPE) is an educational services provider known for its operation at Grand Canyon University.
Revenue Growth
A company’s long-term sales performance can indicate its overall quality. Any business can have short-term success, but a top-tier one grows for years. Unfortunately, Grand Canyon Education’s 5.9% annualized revenue growth over the last five years was sluggish. This wasn’t a great result compared to the rest of the consumer discretionary sector, but there are still things to like about Grand Canyon Education.
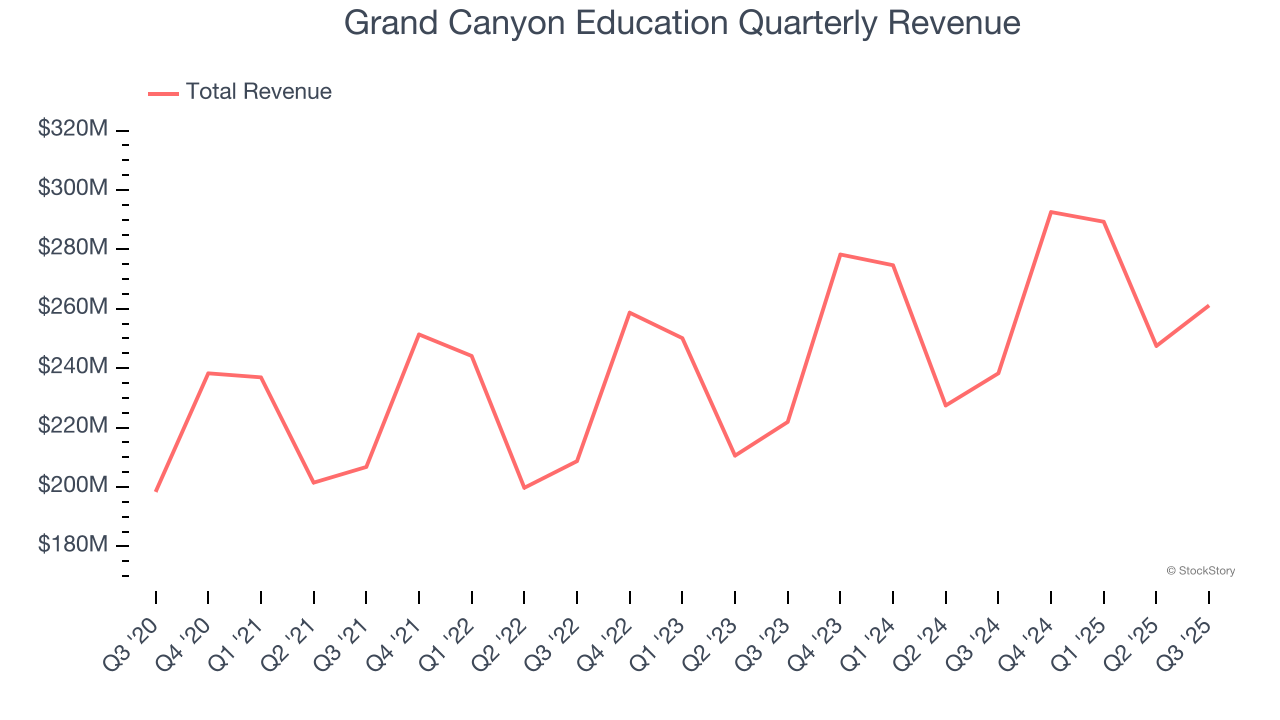
Long-term growth is the most important, but within consumer discretionary, product cycles are short and revenue can be hit-driven due to rapidly changing trends and consumer preferences. Grand Canyon Education’s annualized revenue growth of 7.6% over the last two years is above its five-year trend, but we were still disappointed by the results. 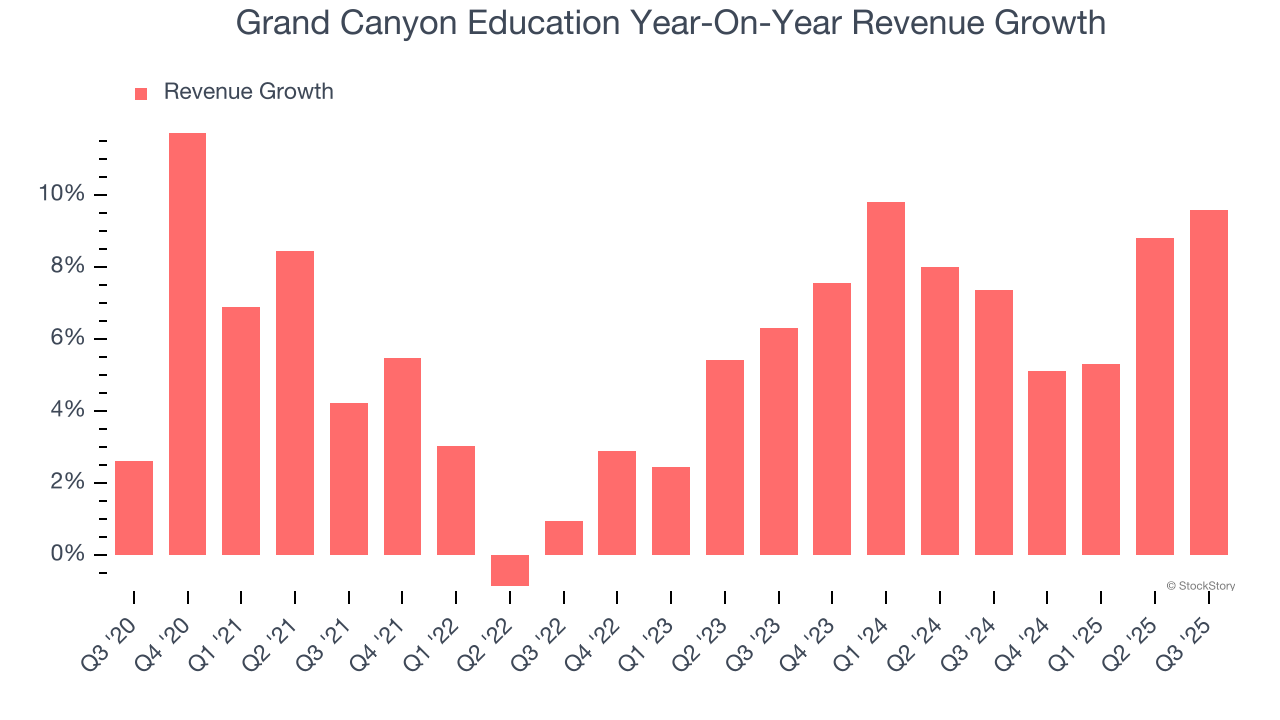
We can better understand the company’s revenue dynamics by analyzing its number of students, which reached 132,486 in the latest quarter. Over the last two years, Grand Canyon Education’s students averaged 6.2% year-on-year growth. Because this number aligns with its revenue growth during the same period, we can see the company’s monetization was fairly consistent. 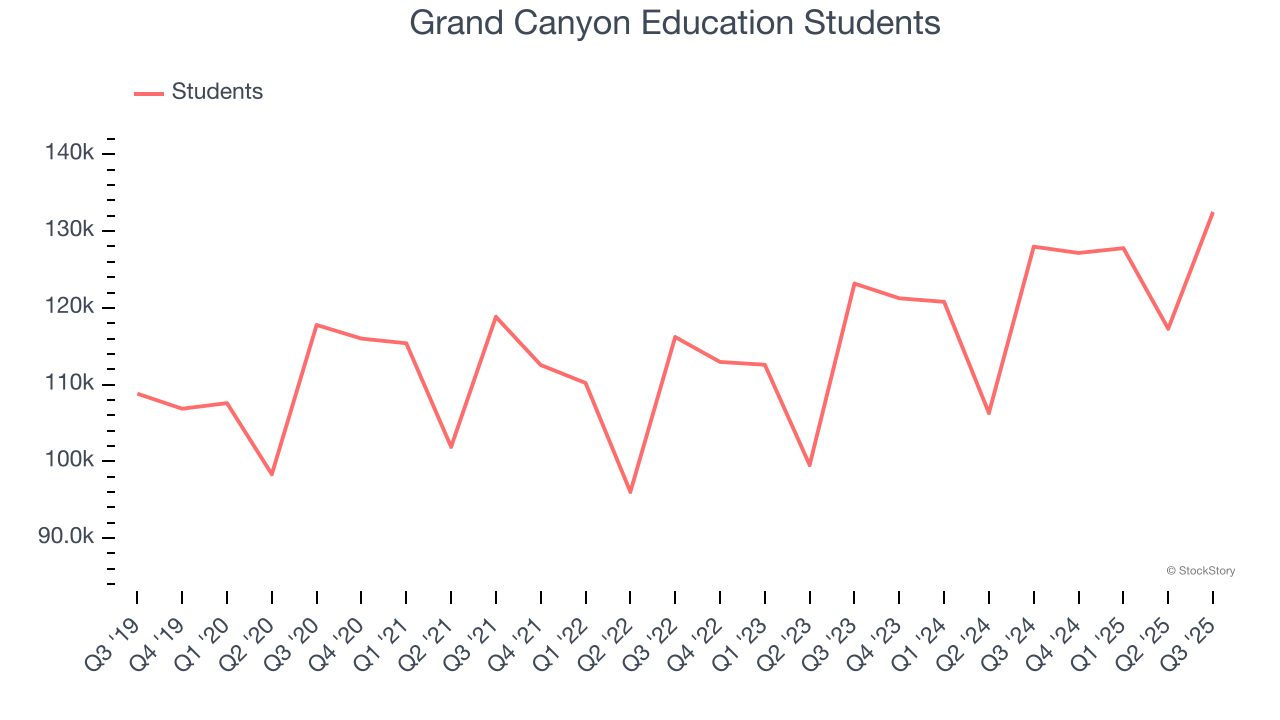
This quarter, Grand Canyon Education grew its revenue by 9.6% year on year, and its $261.1 million of revenue was in line with Wall Street’s estimates. Company management is currently guiding for a 5.1% year-on-year increase in sales next quarter.
Looking further ahead, sell-side analysts expect revenue to grow 6.5% over the next 12 months, similar to its two-year rate. This projection doesn't excite us and suggests its products and services will see some demand headwinds. At least the company is tracking well in other measures of financial health.
The 1999 book Gorilla Game predicted Microsoft and Apple would dominate tech before it happened. Its thesis? Identify the platform winners early. Today, enterprise software companies embedding generative AI are becoming the new gorillas. a profitable, fast-growing enterprise software stock that is already riding the automation wave and looking to catch the generative AI next.
Operating Margin
Operating margin is a key measure of profitability. Think of it as net income - the bottom line - excluding the impact of taxes and interest on debt, which are less connected to business fundamentals.
Grand Canyon Education’s operating margin has been trending down over the last 12 months, but it still averaged 25.2% over the last two years, elite for a consumer discretionary business. This shows it’s an well-run company with an efficient cost structure, and we wouldn’t weigh the short-term trend too heavily.

In Q3, Grand Canyon Education generated an operating margin profit margin of 6.9%, down 13.3 percentage points year on year. This contraction shows it was less efficient because its expenses grew faster than its revenue.
Earnings Per Share
We track the long-term change in earnings per share (EPS) for the same reason as long-term revenue growth. Compared to revenue, however, EPS highlights whether a company’s growth is profitable.
Grand Canyon Education’s unimpressive 7.4% annual EPS growth over the last five years aligns with its revenue performance. This tells us it maintained its per-share profitability as it expanded.

In Q3, Grand Canyon Education reported EPS of $0.58, down from $1.42 in the same quarter last year. This print missed analysts’ estimates. Over the next 12 months, Wall Street expects Grand Canyon Education’s full-year EPS of $7.42 to grow 26.1%.
Key Takeaways from Grand Canyon Education’s Q3 Results
It was encouraging to see Grand Canyon Education beat analysts’ EBITDA expectations this quarter. On the other hand, its full-year EPS guidance missed and its number of students fell short of Wall Street’s estimates. Overall, this was a softer quarter. The stock traded down 1.9% to $174.72 immediately after reporting.
The latest quarter from Grand Canyon Education’s wasn’t that good. One earnings report doesn’t define a company’s quality, though, so let’s explore whether the stock is a buy at the current price. If you’re making that decision, you should consider the bigger picture of valuation, business qualities, as well as the latest earnings. We cover that in our actionable full research report which you can read here, it’s free for active Edge members.