Biopharma company Jazz Pharmaceuticals (NASDAQ: JAZZ) reported revenue ahead of Wall Streets expectations in Q3 CY2025, with sales up 6.7% year on year to $1.13 billion. The company expects the full year’s revenue to be around $4.23 billion, close to analysts’ estimates. Its non-GAAP profit of $8.13 per share was 39% above analysts’ consensus estimates.
Is now the time to buy Jazz Pharmaceuticals? Find out by accessing our full research report, it’s free for active Edge members.
Jazz Pharmaceuticals (JAZZ) Q3 CY2025 Highlights:
- Revenue: $1.13 billion vs analyst estimates of $1.11 billion (6.7% year-on-year growth, 1.4% beat)
- Adjusted EPS: $8.13 vs analyst estimates of $5.85 (39% beat)
- The company reconfirmed its revenue guidance for the full year of $4.23 billion at the midpoint
- Management raised its full-year Adjusted EPS guidance to $8.05 at the midpoint, a 54.8% increase
- Operating Margin: 5.1%, down from 24.7% in the same quarter last year
- Market Capitalization: $8.36 billion
Company Overview
Originally founded in 2003 and now headquartered in Ireland following a 2012 tax inversion merger, Jazz Pharmaceuticals (NASDAQGS:JAZZ) develops and markets medicines for sleep disorders, epilepsy, and cancer, with a focus on treatments for patients with limited therapeutic options.
Revenue Growth
A company’s long-term sales performance is one signal of its overall quality. Any business can have short-term success, but a top-tier one grows for years. Thankfully, Jazz Pharmaceuticals’s 12.8% annualized revenue growth over the last five years was solid. Its growth beat the average healthcare company and shows its offerings resonate with customers.
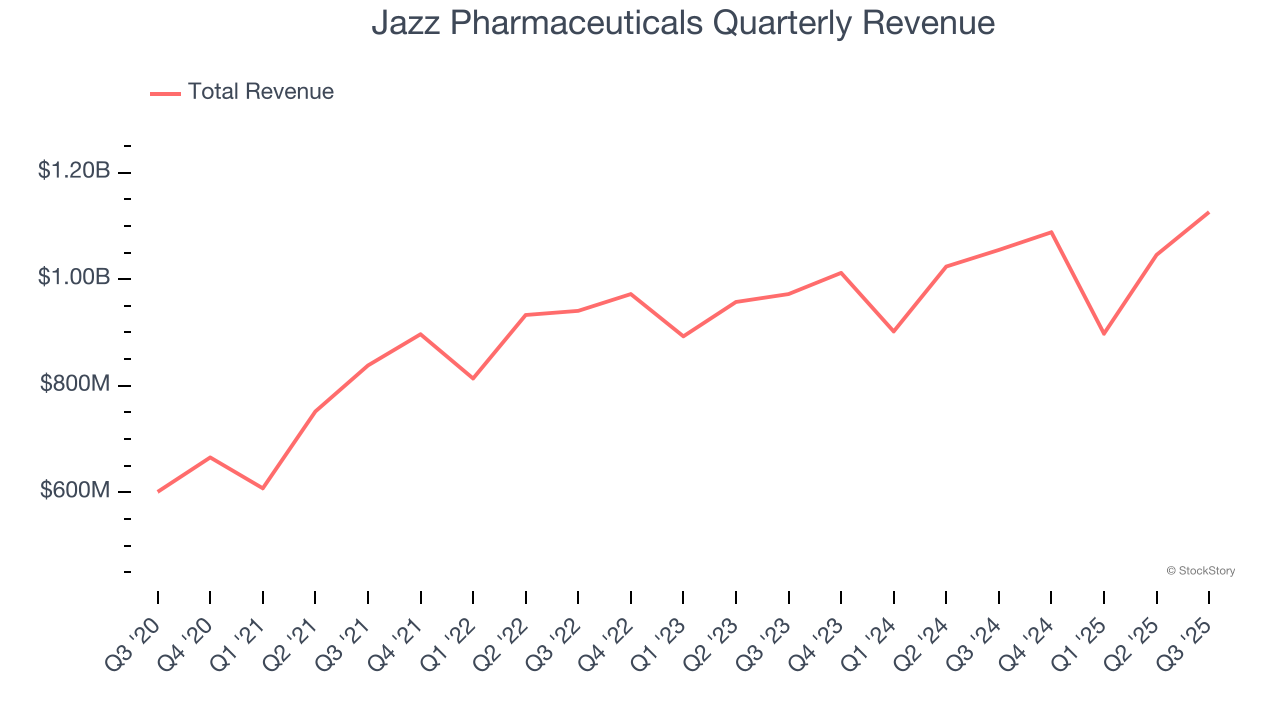
We at StockStory place the most emphasis on long-term growth, but within healthcare, a half-decade historical view may miss recent innovations or disruptive industry trends. Jazz Pharmaceuticals’s recent performance shows its demand has slowed as its annualized revenue growth of 4.7% over the last two years was below its five-year trend. 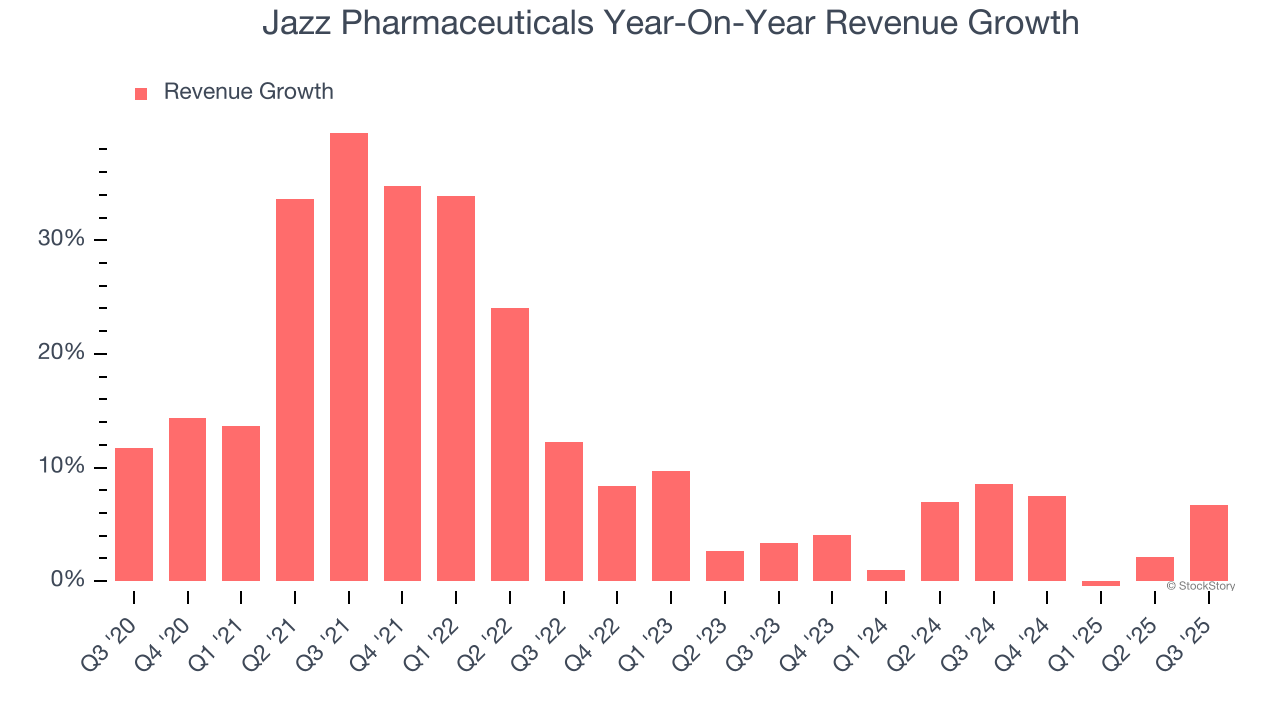
This quarter, Jazz Pharmaceuticals reported year-on-year revenue growth of 6.7%, and its $1.13 billion of revenue exceeded Wall Street’s estimates by 1.4%.
Looking ahead, sell-side analysts expect revenue to grow 6.2% over the next 12 months, an improvement versus the last two years. This projection is above the sector average and suggests its newer products and services will catalyze better top-line performance.
While Wall Street chases Nvidia at all-time highs, an under-the-radar semiconductor supplier is dominating a critical AI component these giants can’t build without. Click here to access our free report one of our favorites growth stories.
Operating Margin
Operating margin is one of the best measures of profitability because it tells us how much money a company takes home after subtracting all core expenses, like marketing and R&D.
Jazz Pharmaceuticals was profitable over the last five years but held back by its large cost base. Its average operating margin of 4.8% was weak for a healthcare business.
Analyzing the trend in its profitability, Jazz Pharmaceuticals’s operating margin decreased by 22.2 percentage points over the last five years. The company’s two-year trajectory also shows it failed to get its profitability back to the peak as its margin fell by 17 percentage points. This performance was poor no matter how you look at it - it shows its expenses were rising and it couldn’t pass those costs onto its customers.
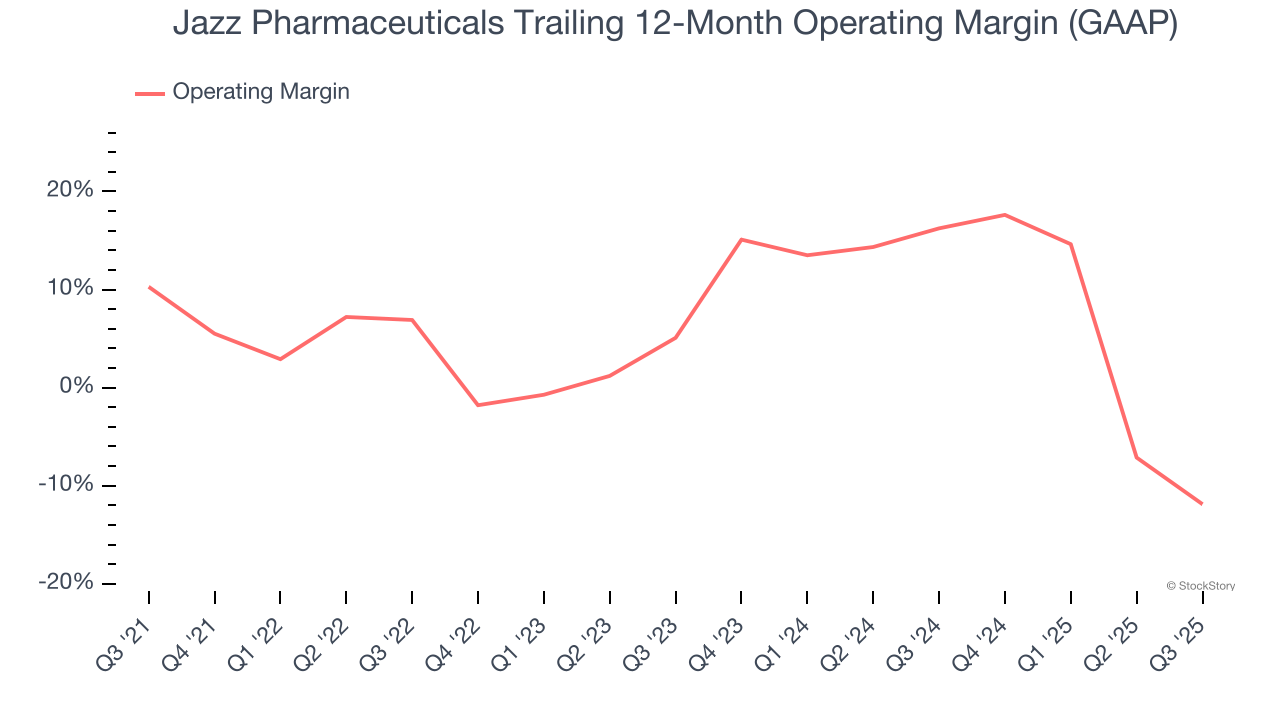
In Q3, Jazz Pharmaceuticals generated an operating margin profit margin of 5.1%, down 19.6 percentage points year on year. This contraction shows it was less efficient because its expenses grew faster than its revenue.
Earnings Per Share
We track the long-term change in earnings per share (EPS) for the same reason as long-term revenue growth. Compared to revenue, however, EPS highlights whether a company’s growth is profitable.
Sadly for Jazz Pharmaceuticals, its EPS declined by 8.7% annually over the last five years while its revenue grew by 12.8%. This tells us the company became less profitable on a per-share basis as it expanded.
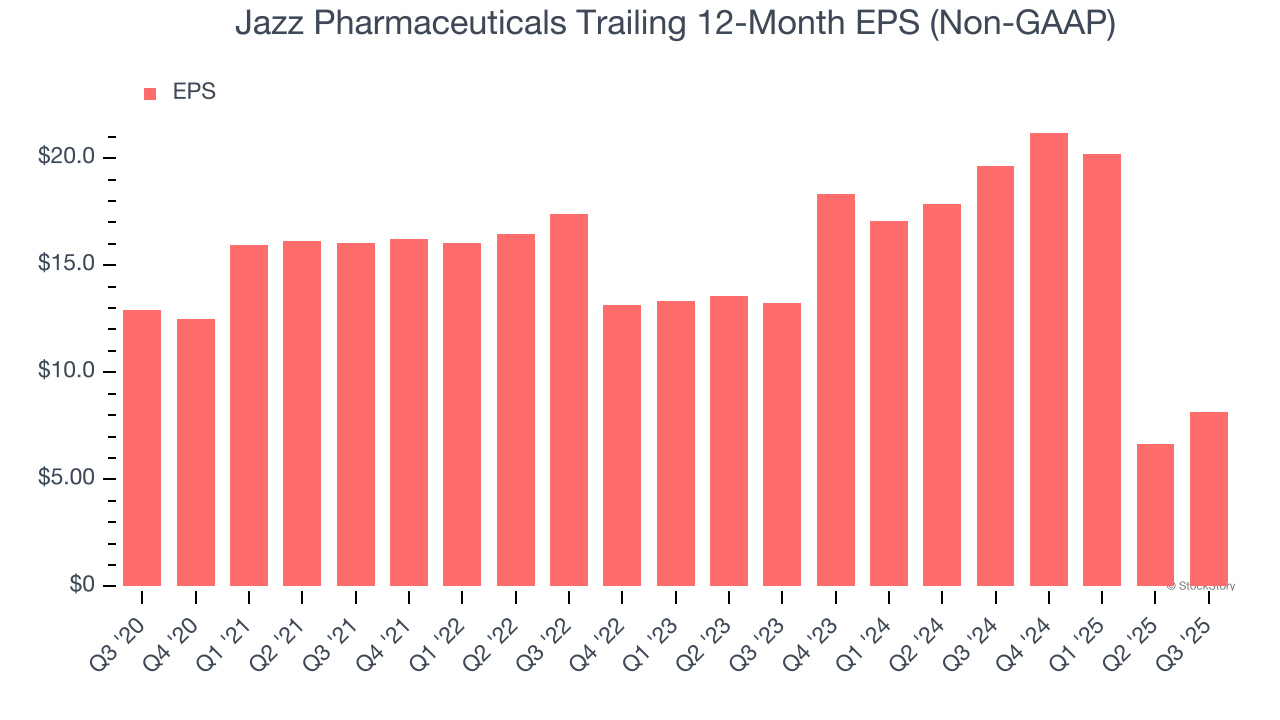
We can take a deeper look into Jazz Pharmaceuticals’s earnings to better understand the drivers of its performance. As we mentioned earlier, Jazz Pharmaceuticals’s operating margin declined by 22.2 percentage points over the last five years. Its share count also grew by 9.5%, meaning the company not only became less efficient with its operating expenses but also diluted its shareholders. 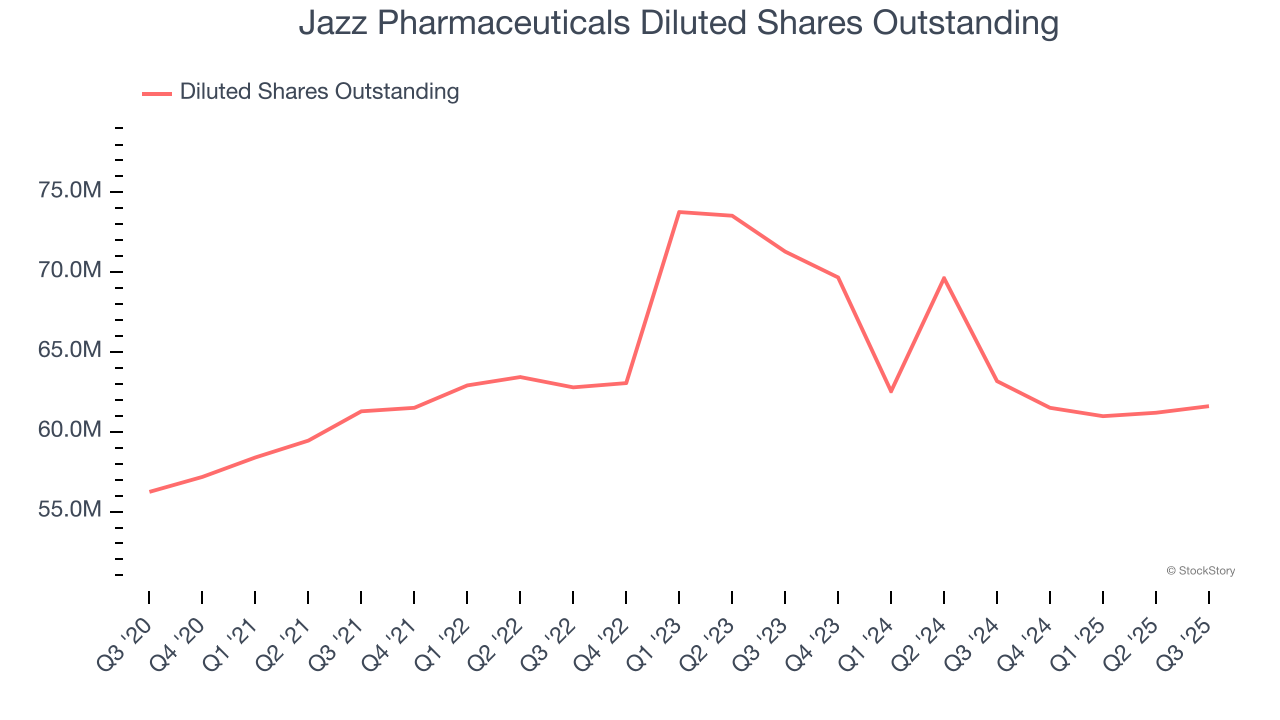
In Q3, Jazz Pharmaceuticals reported adjusted EPS of $8.13, up from $6.61 in the same quarter last year. This print easily cleared analysts’ estimates, and shareholders should be content with the results. Over the next 12 months, Wall Street expects Jazz Pharmaceuticals’s full-year EPS of $8.16 to grow 151%.
Key Takeaways from Jazz Pharmaceuticals’s Q3 Results
It was good to see Jazz Pharmaceuticals beat analysts’ EPS expectations this quarter. We were also excited its full-year EPS guidance outperformed Wall Street’s estimates by a wide margin. Zooming out, we think this was a solid print. The stock remained flat at $137.22 immediately after reporting.
Is Jazz Pharmaceuticals an attractive investment opportunity right now? If you’re making that decision, you should consider the bigger picture of valuation, business qualities, as well as the latest earnings. We cover that in our actionable full research report which you can read here, it’s free for active Edge members.