Luxury electric car manufacturer Lucid (NASDAQ: LCID) fell short of the markets revenue expectations in Q3 CY2025, but sales rose 68.3% year on year to $336.6 million. Its non-GAAP loss of $2.65 per share was 19.4% below analysts’ consensus estimates.
Is now the time to buy Lucid? Find out by accessing our full research report, it’s free for active Edge members.
Lucid (LCID) Q3 CY2025 Highlights:
- Revenue: $336.6 million vs analyst estimates of $347.8 million (68.3% year-on-year growth, 3.2% miss)
- Adjusted EPS: -$2.65 vs analyst expectations of -$2.22 (19.4% miss)
- Adjusted EBITDA: -$717.7 million vs analyst estimates of -$616 million (-213% margin, 16.5% miss)
- Operating Margin: -280%, up from -385% in the same quarter last year
- Free Cash Flow was -$955.5 million compared to -$622.5 million in the same quarter last year
- Sales Volumes rose 47% year on year (90.9% in the same quarter last year)
- Market Capitalization: $5.03 billion
"We maintained strong operational momentum this quarter, delivering solid results in both production and customer deliveries," said Marc Winterhoff, Interim CEO at Lucid.
Company Overview
Founded by a former Tesla Vice President, Lucid Group (NASDAQ: LCID) designs, manufactures, and sells luxury electric vehicles with long-range capabilities.
Revenue Growth
Reviewing a company’s long-term sales performance reveals insights into its quality. Even a bad business can shine for one or two quarters, but a top-tier one grows for years. Over the last five years, Lucid grew its sales at an incredible 341% compounded annual growth rate. Its growth beat the average industrials company and shows its offerings resonate with customers.
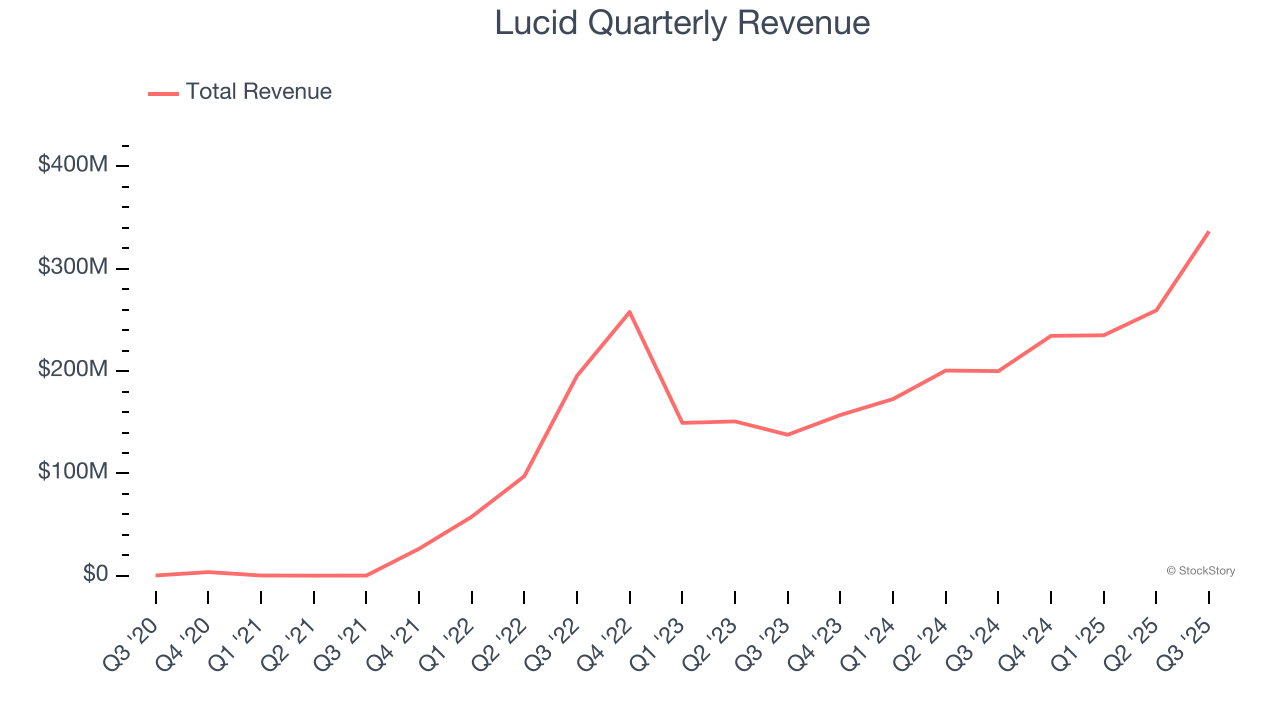
Long-term growth is the most important, but within industrials, a half-decade historical view may miss new industry trends or demand cycles. Lucid’s annualized revenue growth of 23.7% over the last two years is below its five-year trend, but we still think the results suggest healthy demand. 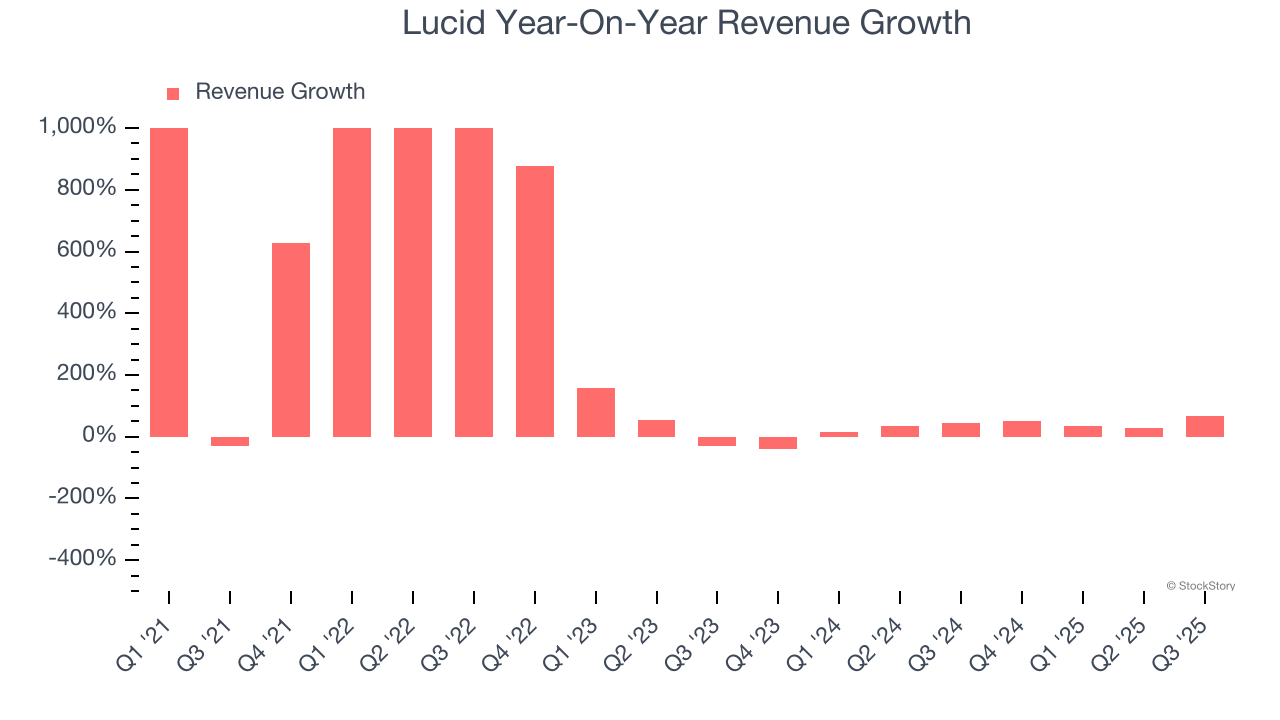
We can better understand the company’s revenue dynamics by analyzing its number of units sold, which reached 4,078 in the latest quarter. Over the last two years, Lucid’s units sold grew by 48.1% annually. Because this number is better than its revenue growth, we can see the company’s average selling price decreased. 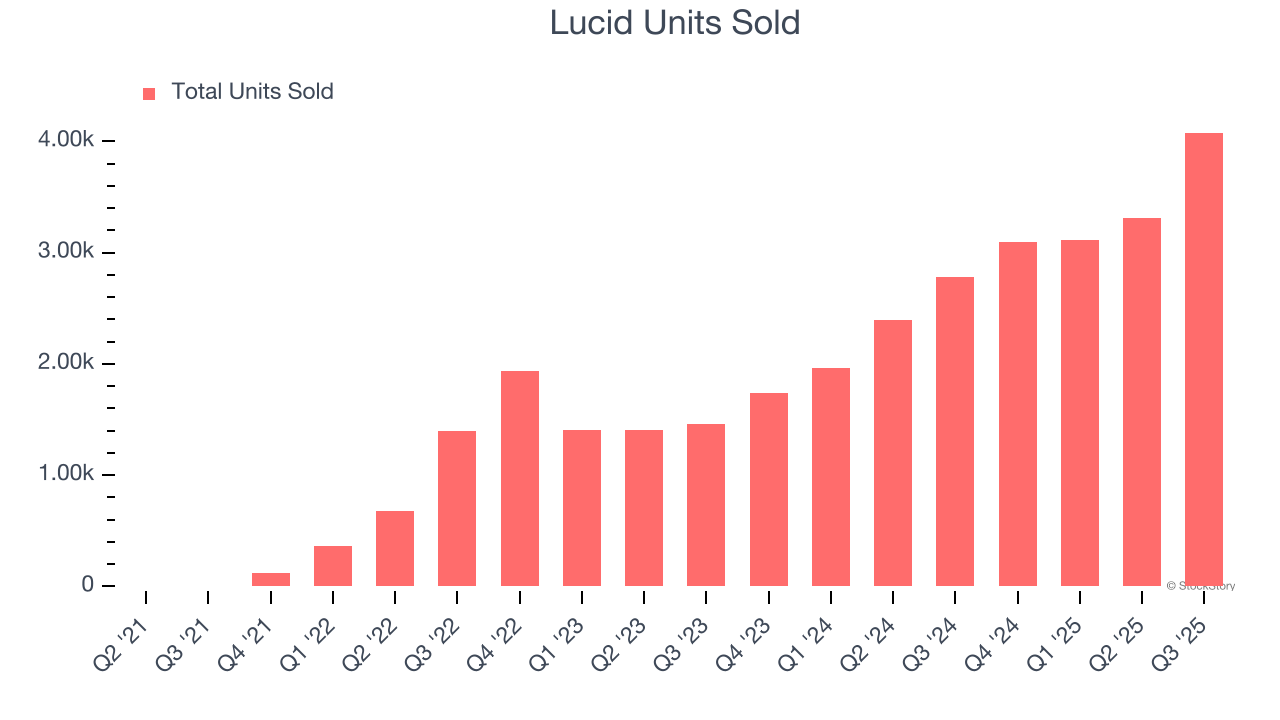
This quarter, Lucid achieved a magnificent 68.3% year-on-year revenue growth rate, but its $336.6 million of revenue fell short of Wall Street’s lofty estimates.
Looking ahead, sell-side analysts expect revenue to grow 131% over the next 12 months, an improvement versus the last two years. This projection is eye-popping and suggests its newer products and services will spur better top-line performance.
While Wall Street chases Nvidia at all-time highs, an under-the-radar semiconductor supplier is dominating a critical AI component these giants can’t build without. Click here to access our free report one of our favorites growth stories.
Operating Margin
Lucid’s high expenses have contributed to an average operating margin of negative 448% over the last five years. Unprofitable industrials companies require extra attention because they could get caught swimming naked when the tide goes out. It’s hard to trust that the business can endure a full cycle.
On the plus side, Lucid’s operating margin rose over the last five years, as its sales growth gave it operating leverage. Still, it will take much more for the company to reach long-term profitability.
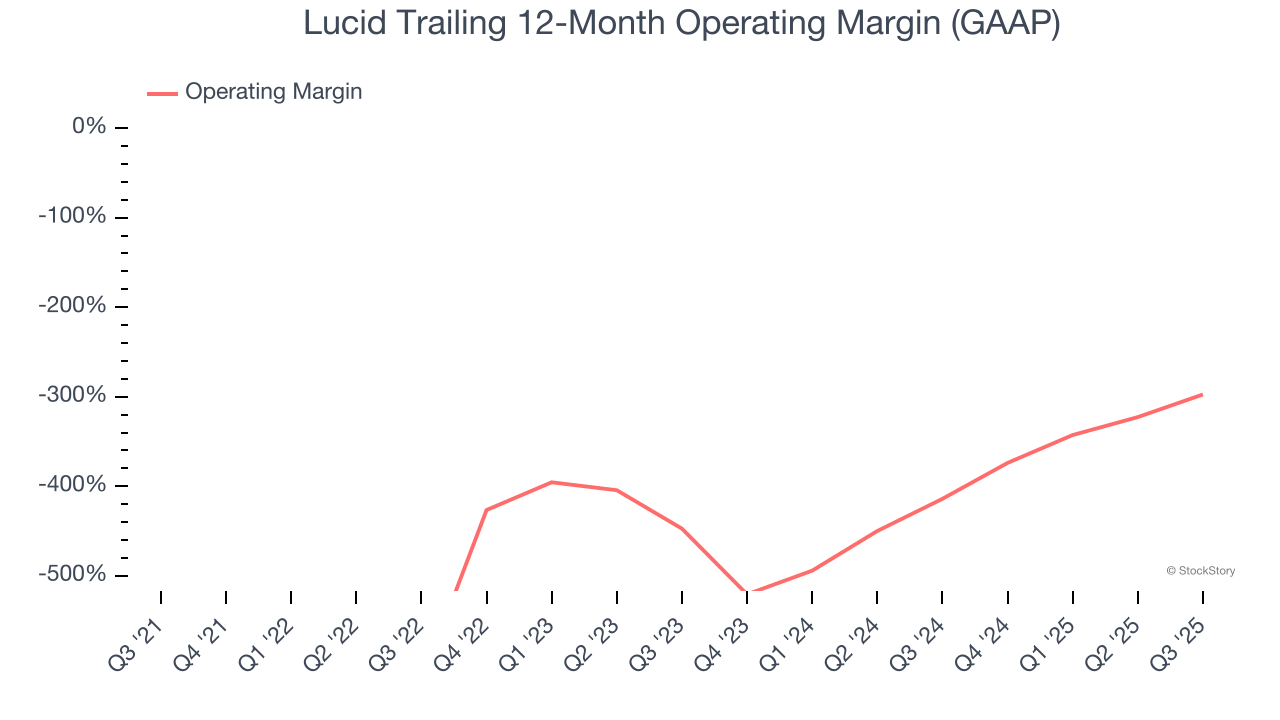
This quarter, Lucid generated a negative 280% operating margin.
Earnings Per Share
Revenue trends explain a company’s historical growth, but the change in earnings per share (EPS) points to the profitability of that growth – for example, a company could inflate its sales through excessive spending on advertising and promotions.
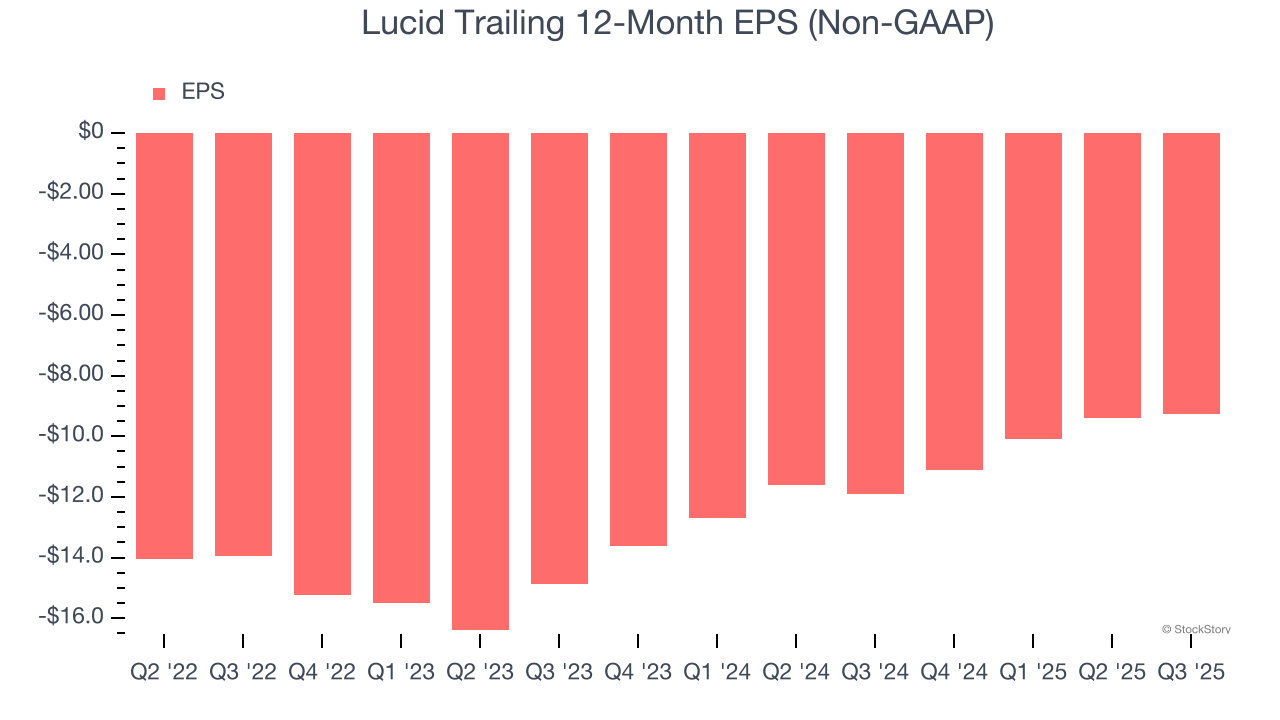
Although Lucid’s full-year earnings are still negative, it reduced its losses and improved its EPS by 21.1% annually over the last two years.
In Q3, Lucid reported adjusted EPS of negative $2.65, up from negative $2.80 in the same quarter last year. Despite growing year on year, this print missed analysts’ estimates. We also like to analyze expected EPS growth based on Wall Street analysts’ consensus projections, but there is insufficient data.
Key Takeaways from Lucid’s Q3 Results
We struggled to find many positives in these results. Its revenue missed and its EBITDA fell short of Wall Street’s estimates. Overall, this was a weaker quarter. The stock traded down 2.6% to $16.77 immediately after reporting.
Lucid’s latest earnings report disappointed. One quarter doesn’t define a company’s quality, so let’s explore whether the stock is a buy at the current price. The latest quarter does matter, but not nearly as much as longer-term fundamentals and valuation, when deciding if the stock is a buy. We cover that in our actionable full research report which you can read here, it’s free for active Edge members.