
Vacation ownership company Marriott Vacations (NYSE: VAC) fell short of the markets revenue expectations in Q3 CY2025, with sales falling 3.2% year on year to $1.26 billion. Its non-GAAP profit of $1.69 per share was 5.6% above analysts’ consensus estimates.
Is now the time to buy Marriott Vacations? Find out by accessing our full research report, it’s free for active Edge members.
Marriott Vacations (VAC) Q3 CY2025 Highlights:
- Revenue: $1.26 billion vs analyst estimates of $1.32 billion (3.2% year-on-year decline, 4.5% miss)
- Adjusted EPS: $1.69 vs analyst estimates of $1.60 (5.6% beat)
- Adjusted EBITDA: $170 million vs analyst estimates of $184.6 million (13.5% margin, 7.9% miss)
- Management raised its full-year Adjusted EPS guidance to $6.90 at the midpoint, a 2.2% increase
- EBITDA guidance for the full year is $747.5 million at the midpoint, below analyst estimates of $760.1 million
- Guests: 1.5 million, down 45,792 year on year
- Market Capitalization: $2.29 billion
Company Overview
Spun off from Marriott International in 1984, Marriott Vacations (NYSE: VAC) is a vacation company providing leisure experiences for travelers around the world.
Revenue Growth
Reviewing a company’s long-term sales performance reveals insights into its quality. Any business can experience short-term success, but top-performing ones enjoy sustained growth for years. Over the last five years, Marriott Vacations grew its sales at a sluggish 8.9% compounded annual growth rate. This was below our standard for the consumer discretionary sector and is a tough starting point for our analysis.
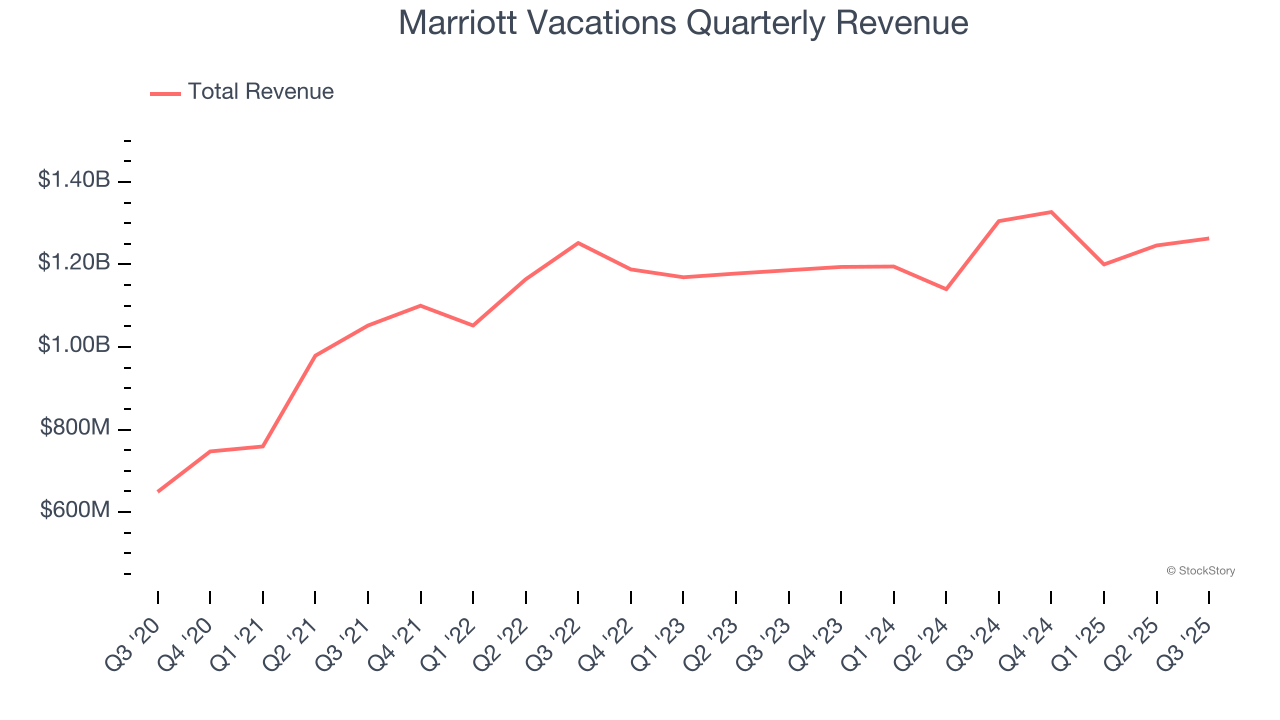
We at StockStory place the most emphasis on long-term growth, but within consumer discretionary, a stretched historical view may miss a company riding a successful new property or trend. Marriott Vacations’s recent performance shows its demand has slowed as its annualized revenue growth of 3.3% over the last two years was below its five-year trend. 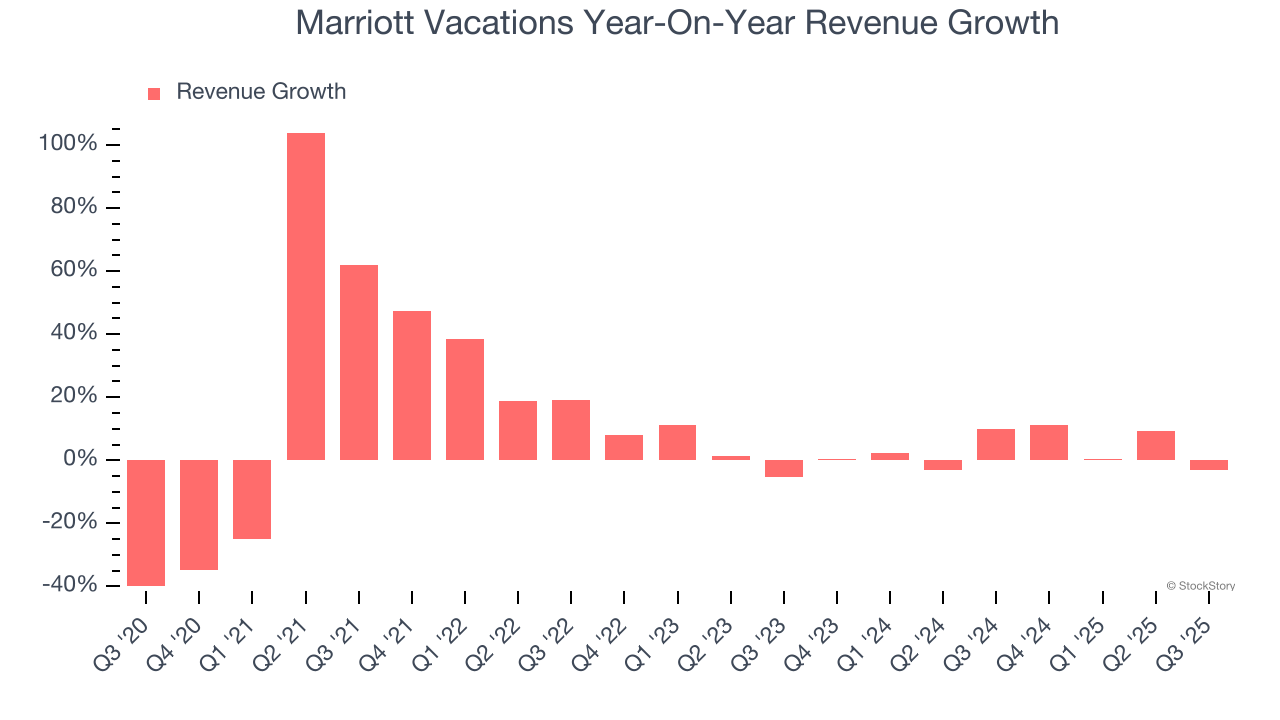
Marriott Vacations also discloses its number of guests and conducted tours, which clocked in at 1.5 million and 109,609 in the latest quarter. Over the last two years, Marriott Vacations’s guests averaged 1.5% year-on-year declines. On the other hand, its conducted tours averaged 3.7% year-on-year growth. 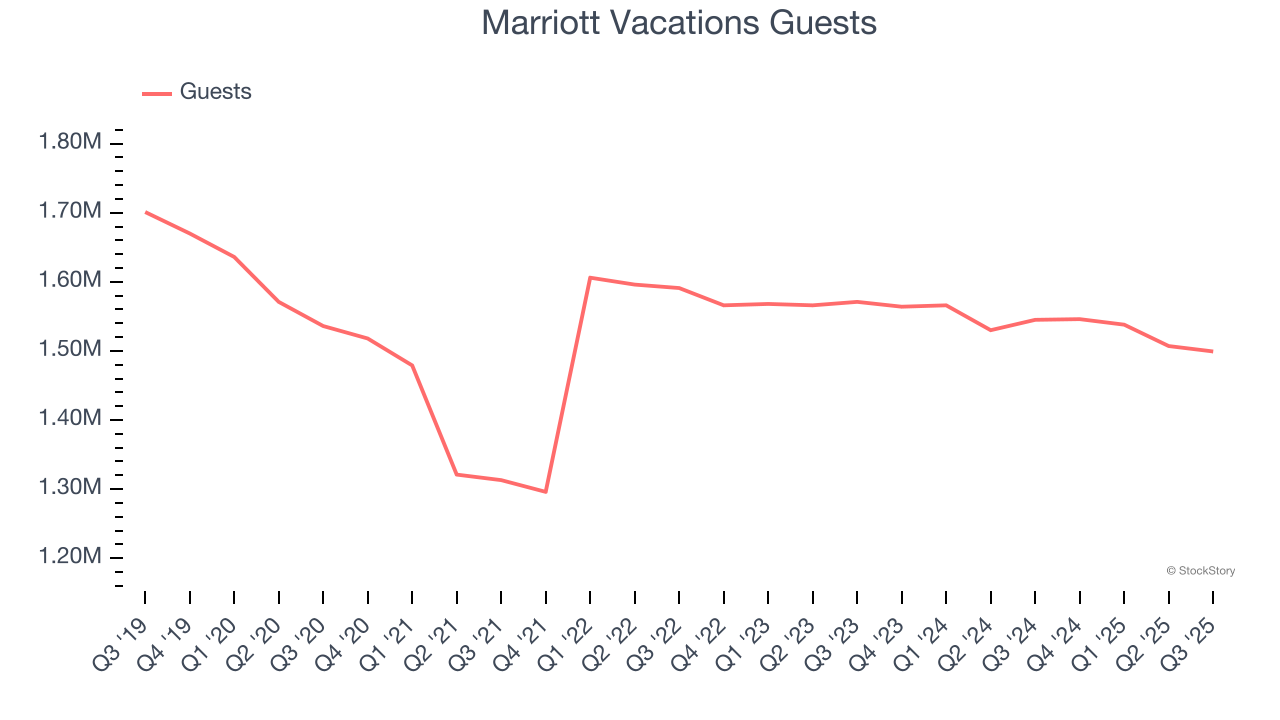
This quarter, Marriott Vacations missed Wall Street’s estimates and reported a rather uninspiring 3.2% year-on-year revenue decline, generating $1.26 billion of revenue.
Looking ahead, sell-side analysts expect revenue to grow 3.6% over the next 12 months, similar to its two-year rate. This projection is underwhelming and suggests its newer products and services will not lead to better top-line performance yet.
The 1999 book Gorilla Game predicted Microsoft and Apple would dominate tech before it happened. Its thesis? Identify the platform winners early. Today, enterprise software companies embedding generative AI are becoming the new gorillas. a profitable, fast-growing enterprise software stock that is already riding the automation wave and looking to catch the generative AI next.
Operating Margin
Operating margin is a key measure of profitability. Think of it as net income - the bottom line - excluding the impact of taxes and interest on debt, which are less connected to business fundamentals.
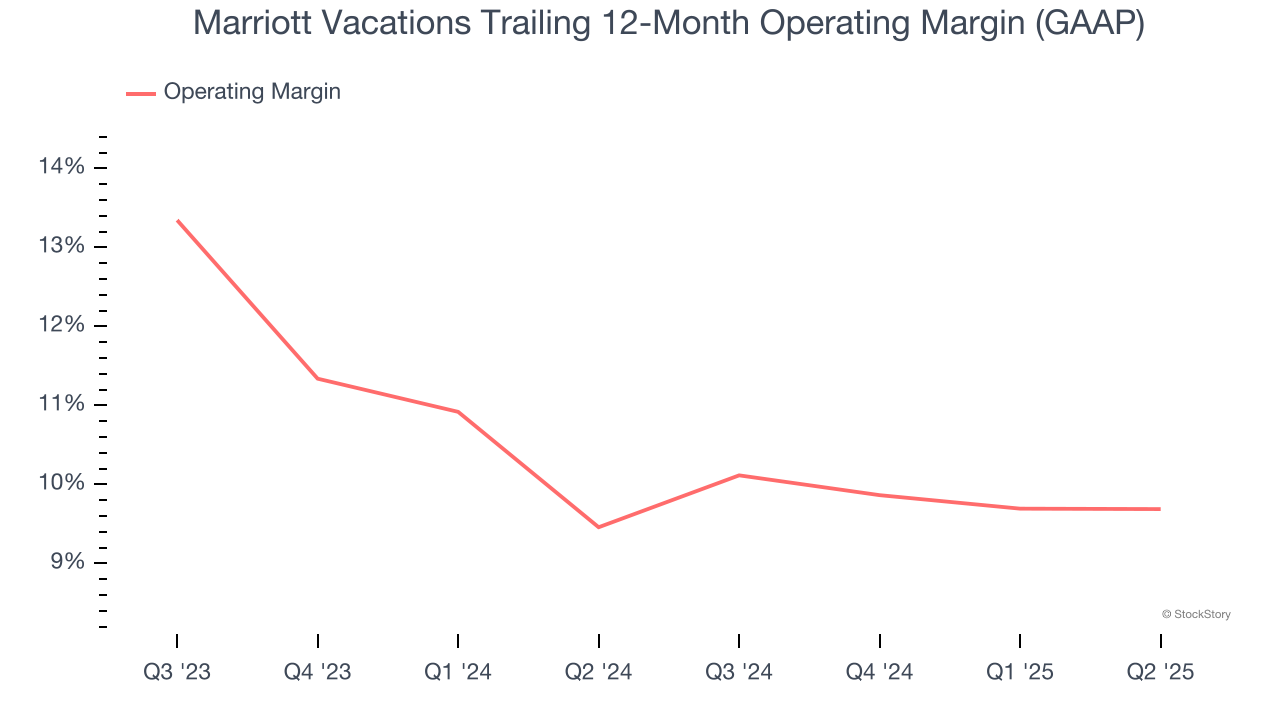
in line with the same quarter last year. This indicates the company’s overall cost structure has been relatively stable.
Earnings Per Share
We track the long-term change in earnings per share (EPS) for the same reason as long-term revenue growth. Compared to revenue, however, EPS highlights whether a company’s growth is profitable.
Marriott Vacations’s full-year EPS flipped from negative to positive over the last five years. This is encouraging and shows it’s at a critical moment in its life.
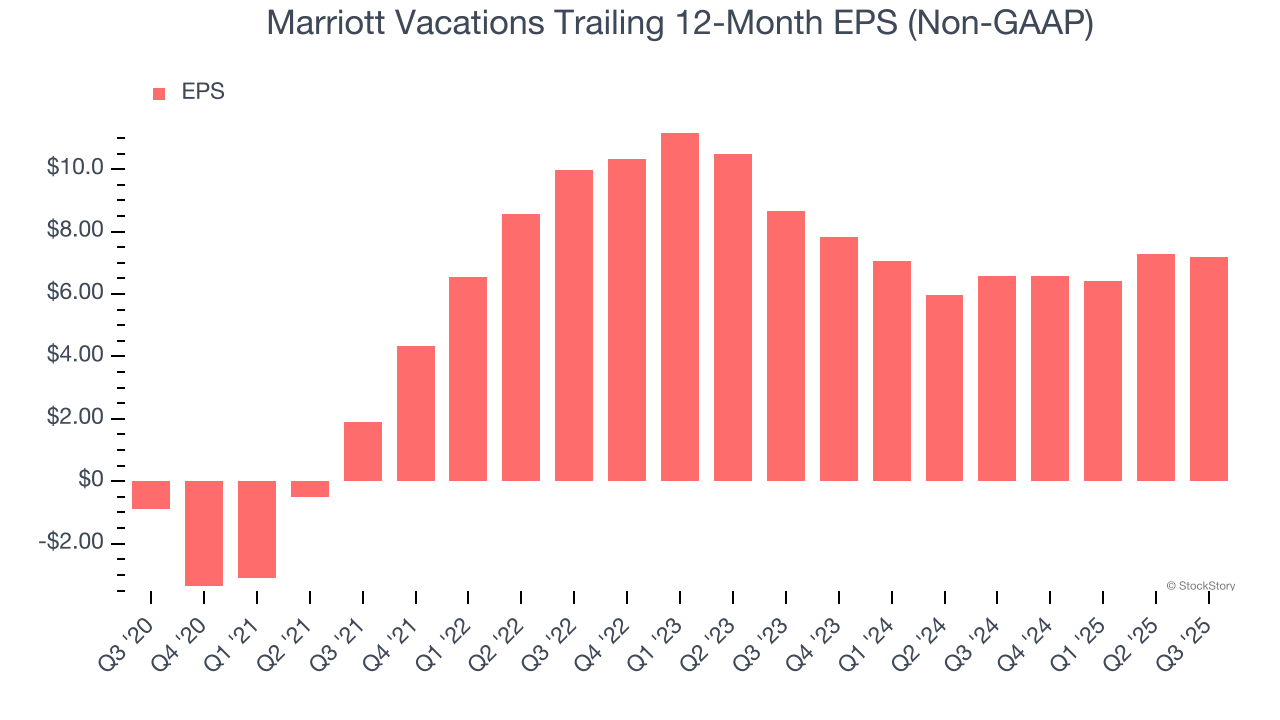
In Q3, Marriott Vacations reported adjusted EPS of $1.69, down from $1.80 in the same quarter last year. Despite falling year on year, this print beat analysts’ estimates by 5.6%. Over the next 12 months, Wall Street expects Marriott Vacations’s full-year EPS of $7.17 to grow 5.6%.
Key Takeaways from Marriott Vacations’s Q3 Results
It was good to see Marriott Vacations beat analysts’ EPS expectations this quarter. On the other hand, its number of conducted tours missed and its revenue fell short of Wall Street’s estimates. Overall, this was a softer quarter. The stock traded down 12.4% to $58.95 immediately after reporting.
Marriott Vacations may have had a tough quarter, but does that actually create an opportunity to invest right now? The latest quarter does matter, but not nearly as much as longer-term fundamentals and valuation, when deciding if the stock is a buy. We cover that in our actionable full research report which you can read here, it’s free for active Edge members.