Healthcare distributor and services company McKesson (NYSE: MCK) missed Wall Street’s revenue expectations in Q3 CY2025, but sales rose 10.1% year on year to $103.2 billion. Its non-GAAP profit of $9.86 per share was 8.9% above analysts’ consensus estimates.
Is now the time to buy McKesson? Find out by accessing our full research report, it’s free for active Edge members.
McKesson (MCK) Q3 CY2025 Highlights:
- Revenue: $103.2 billion vs analyst estimates of $104.1 billion (10.1% year-on-year growth, 0.9% miss)
- Adjusted EPS: $9.86 vs analyst estimates of $9.05 (8.9% beat)
- Management raised its full-year Adjusted EPS guidance to $38.60 at the midpoint, a 2.9% increase
- Operating Margin: 1.4%, in line with the same quarter last year
- Free Cash Flow Margin: 2.2%, similar to the same quarter last year
- Market Capitalization: $104.7 billion
Company Overview
With roots dating back to 1833, making it one of America's oldest continuously operating businesses, McKesson (NYSE: MCK) is a healthcare services company that distributes pharmaceuticals, medical supplies, and provides technology solutions to pharmacies, hospitals, and healthcare providers.
Revenue Growth
Reviewing a company’s long-term sales performance reveals insights into its quality. Any business can have short-term success, but a top-tier one grows for years. Over the last five years, McKesson grew its sales at a decent 10.6% compounded annual growth rate. Its growth was slightly above the average healthcare company and shows its offerings resonate with customers.
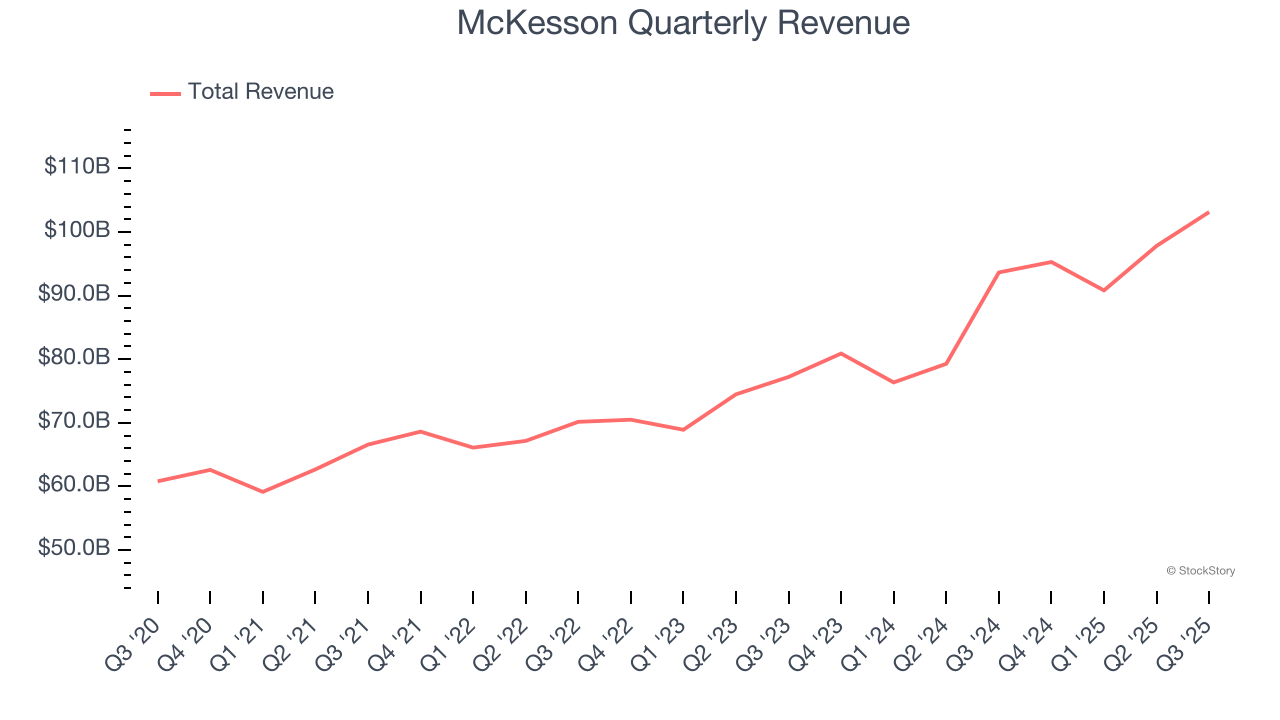
Long-term growth is the most important, but within healthcare, a half-decade historical view may miss new innovations or demand cycles. McKesson’s annualized revenue growth of 15.3% over the last two years is above its five-year trend, suggesting its demand recently accelerated. 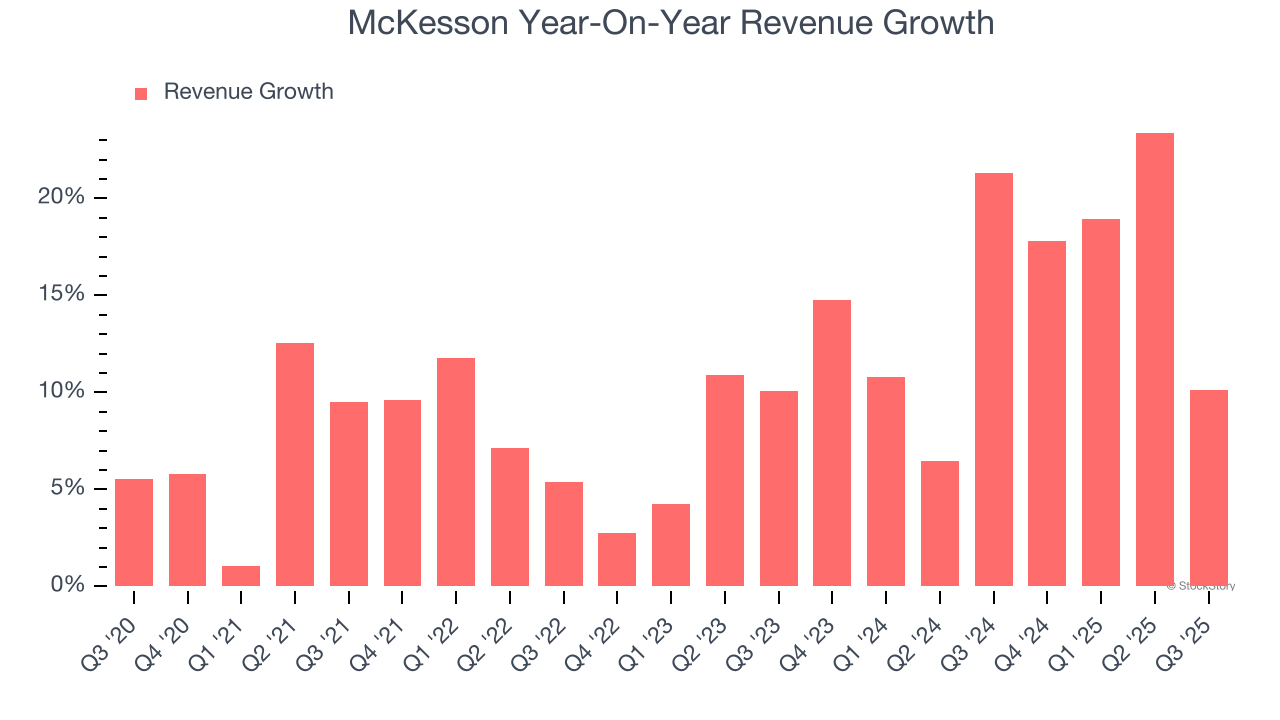
We can dig further into the company’s revenue dynamics by analyzing its most important segment, U.S. Pharmaceutical
. Over the last two years, McKesson’s U.S. Pharmaceutical
revenue averaged 15.7% year-on-year growth. 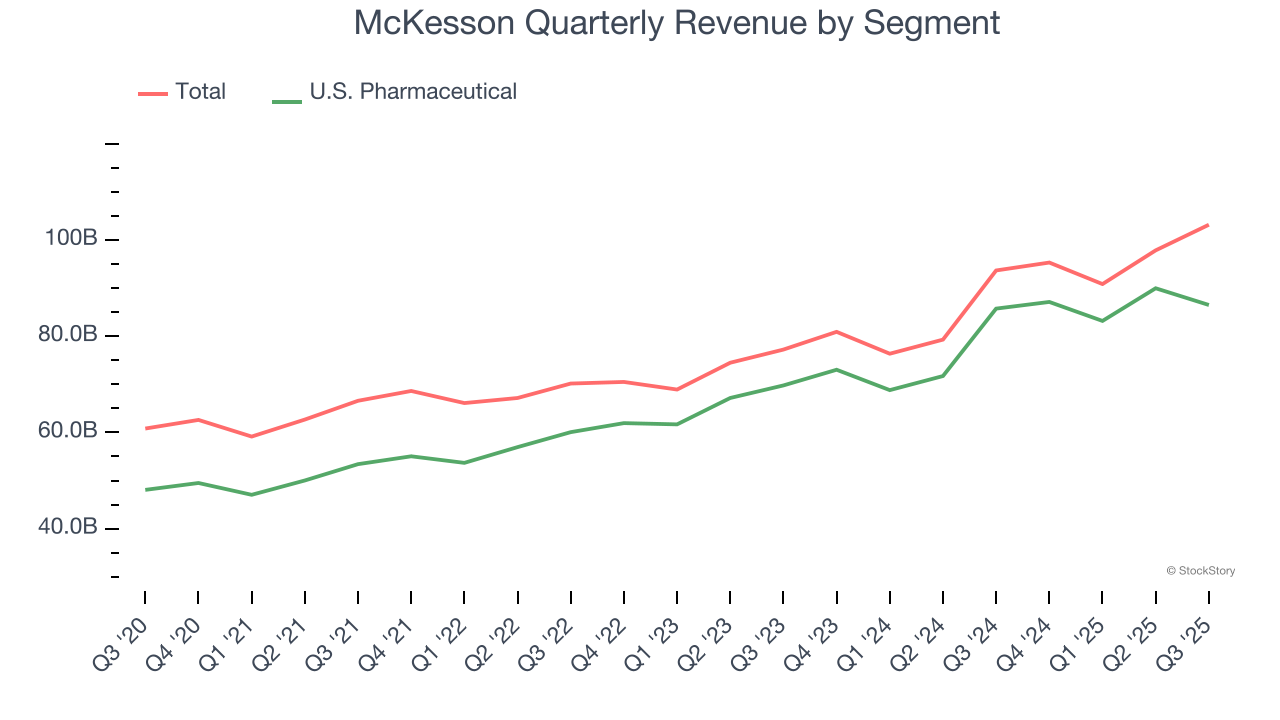
This quarter, McKesson’s revenue grew by 10.1% year on year to $103.2 billion but fell short of Wall Street’s estimates.
Looking ahead, sell-side analysts expect revenue to grow 10.5% over the next 12 months, a deceleration versus the last two years. We still think its growth trajectory is attractive given its scale and implies the market is forecasting success for its products and services.
While Wall Street chases Nvidia at all-time highs, an under-the-radar semiconductor supplier is dominating a critical AI component these giants can’t build without. Click here to access our free report one of our favorites growth stories.
Operating Margin
Operating margin is one of the best measures of profitability because it tells us how much money a company takes home after subtracting all core expenses, like marketing and R&D.
McKesson was roughly breakeven when averaging the last five years of quarterly operating profits, lousy for a healthcare business.
On the plus side, McKesson’s operating margin rose by 3.4 percentage points over the last five years, as its sales growth gave it operating leverage.
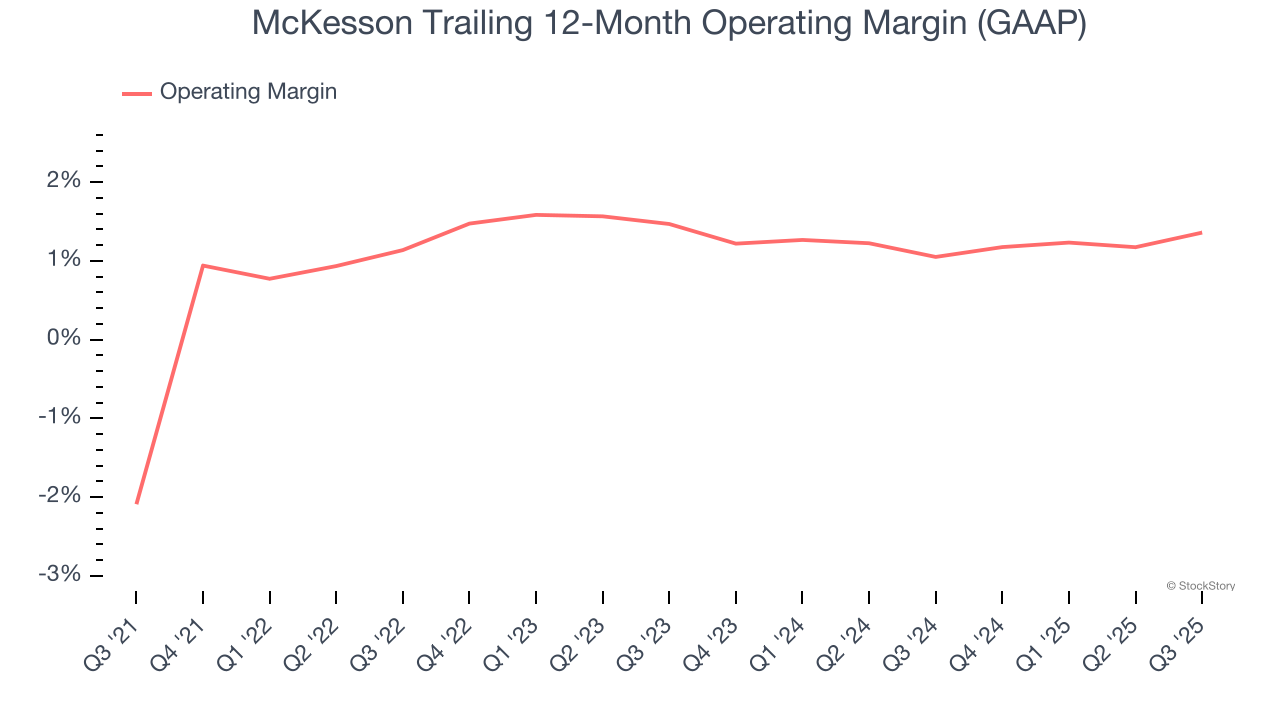
In Q3, McKesson generated an operating margin profit margin of 1.4%, in line with the same quarter last year. This indicates the company’s overall cost structure has been relatively stable.
Earnings Per Share
Revenue trends explain a company’s historical growth, but the long-term change in earnings per share (EPS) points to the profitability of that growth – for example, a company could inflate its sales through excessive spending on advertising and promotions.
McKesson’s EPS grew at an astounding 18.3% compounded annual growth rate over the last five years, higher than its 10.6% annualized revenue growth. This tells us the company became more profitable on a per-share basis as it expanded.
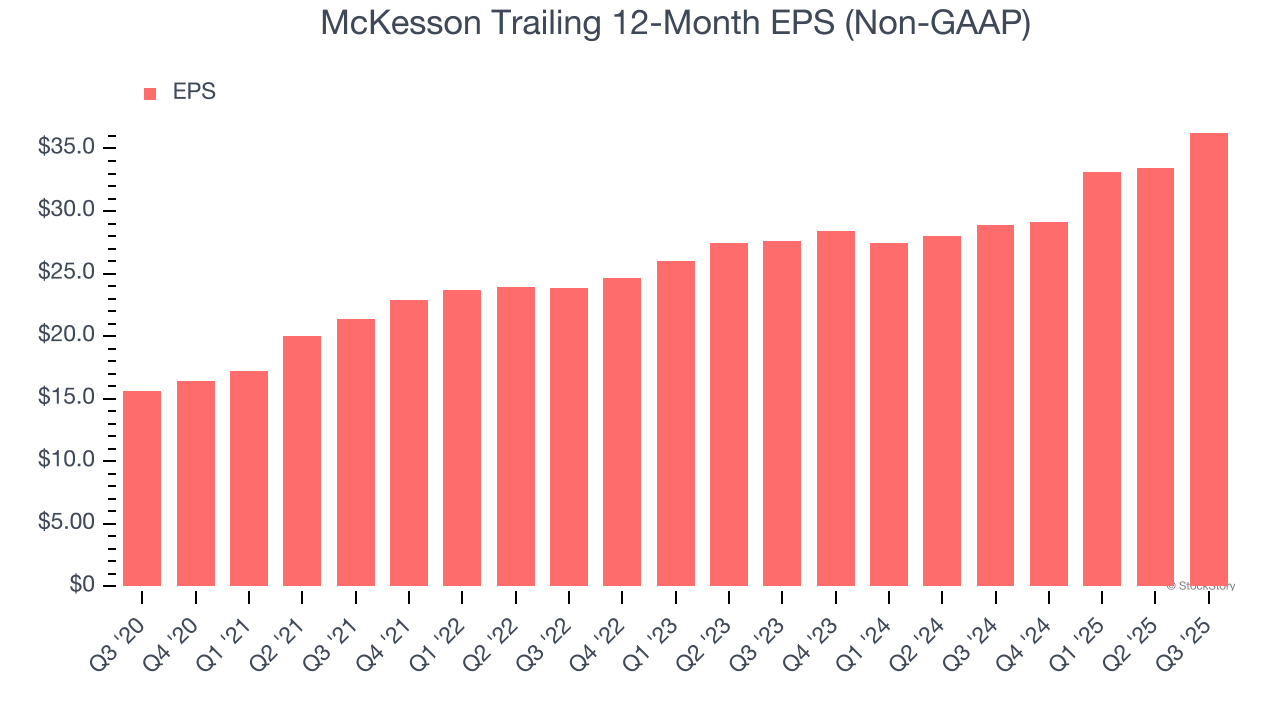
We can take a deeper look into McKesson’s earnings quality to better understand the drivers of its performance. As we mentioned earlier, McKesson’s operating margin was flat this quarter but expanded by 3.4 percentage points over the last five years. On top of that, its share count shrank by 23.8%. These are positive signs for shareholders because improving profitability and share buybacks turbocharge EPS growth relative to revenue growth. 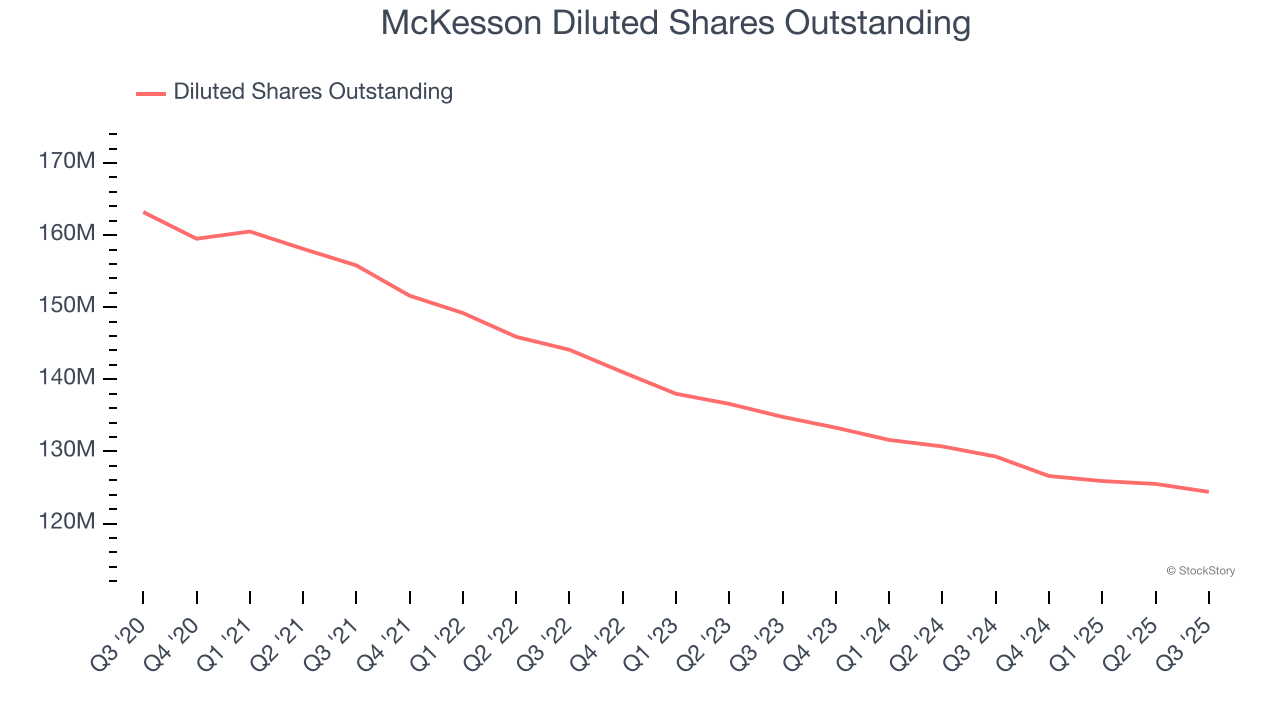
In Q3, McKesson reported adjusted EPS of $9.86, up from $7.07 in the same quarter last year. This print beat analysts’ estimates by 8.9%. Over the next 12 months, Wall Street expects McKesson’s full-year EPS of $36.27 to grow 13.1%.
Key Takeaways from McKesson’s Q3 Results
It was good to see McKesson beat analysts’ EPS expectations this quarter. We were also happy its full-year EPS guidance narrowly outperformed Wall Street’s estimates. On the other hand, its revenue slightly missed. Overall, this was a mixed quarter. The stock traded up 2.2% to $864 immediately after reporting.
Big picture, is McKesson a buy here and now? We think that the latest quarter is only one piece of the longer-term business quality puzzle. Quality, when combined with valuation, can help determine if the stock is a buy. We cover that in our actionable full research report which you can read here, it’s free for active Edge members.


