
Optical retailer National Vision (NYSE: EYE) reported Q3 CY2025 results exceeding the market’s revenue expectations, with sales up 7.9% year on year to $487.3 million. The company’s full-year revenue guidance of $1.98 billion at the midpoint came in 1% above analysts’ estimates. Its non-GAAP profit of $0.13 per share was in line with analysts’ consensus estimates.
Is now the time to buy National Vision? Find out by accessing our full research report, it’s free for active Edge members.
National Vision (EYE) Q3 CY2025 Highlights:
- Revenue: $487.3 million vs analyst estimates of $473.4 million (7.9% year-on-year growth, 3% beat)
- Adjusted EPS: $0.13 vs analyst estimates of $0.13 (in line)
- Adjusted EBITDA: $41.82 million vs analyst estimates of $42.59 million (8.6% margin, 1.8% miss)
- The company lifted its revenue guidance for the full year to $1.98 billion at the midpoint from $1.95 billion, a 1.4% increase
- Management raised its full-year Adjusted EPS guidance to $0.67 at the midpoint, a 1.5% increase
- Operating Margin: 2%, up from -2% in the same quarter last year
- Free Cash Flow Margin: 6.2%, up from 0.9% in the same quarter last year
- Locations: 1,242 at quarter end, up from 1,231 in the same quarter last year
- Same-Store Sales rose 6.8% year on year (0.9% in the same quarter last year)
- Market Capitalization: $2.03 billion
"Our strong performance this quarter demonstrates that our team’s focused execution on our initiatives is delivering results," said Alex Wilkes, National Vision’s CEO.
Company Overview
Operating under multiple brands, National Vision (NYSE: EYE) sells optical products such as eyeglasses and provides optical services such as eye exams.
Revenue Growth
A company’s long-term sales performance is one signal of its overall quality. Any business can experience short-term success, but top-performing ones enjoy sustained growth for years.
With $1.92 billion in revenue over the past 12 months, National Vision is a small retailer, which sometimes brings disadvantages compared to larger competitors benefiting from economies of scale and negotiating leverage with suppliers.
As you can see below, National Vision’s 2.3% annualized revenue growth over the last six years (we compare to 2019 to normalize for COVID-19 impacts) was sluggish as it closed stores.
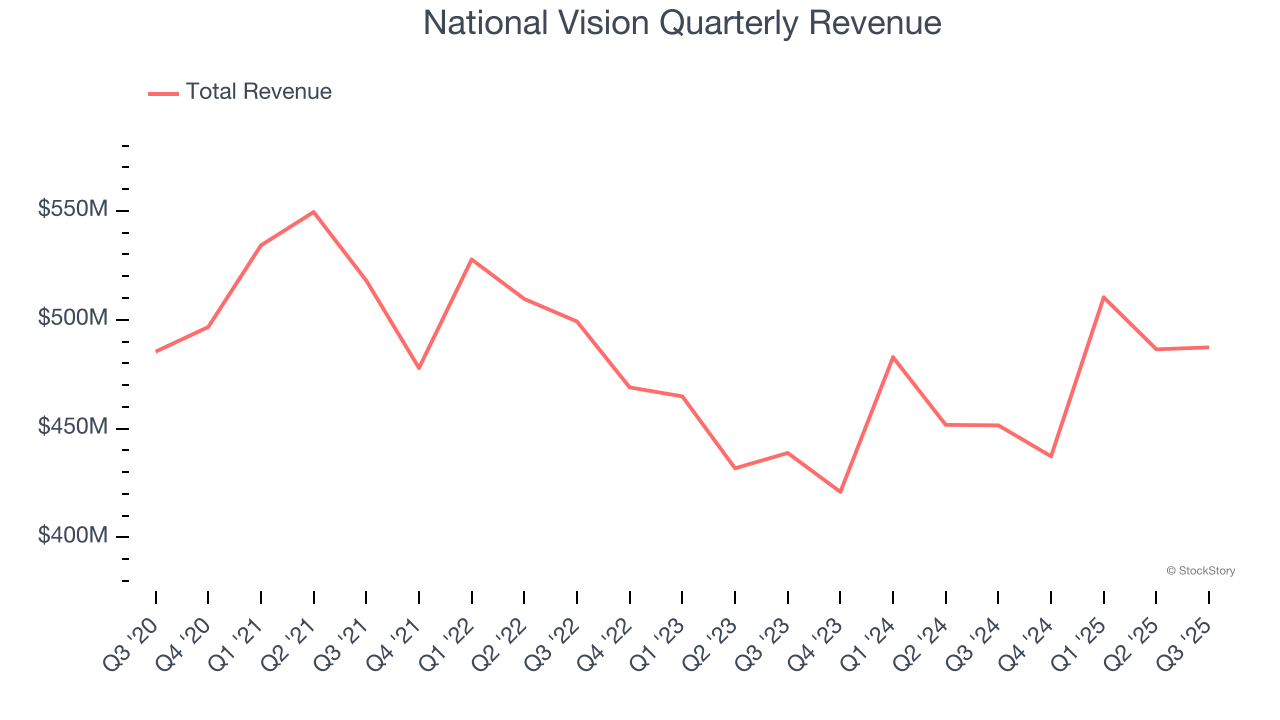
This quarter, National Vision reported year-on-year revenue growth of 7.9%, and its $487.3 million of revenue exceeded Wall Street’s estimates by 3%.
Looking ahead, sell-side analysts expect revenue to grow 5.8% over the next 12 months, an acceleration versus the last six years. This projection is healthy and indicates its newer products will spur better top-line performance.
Microsoft, Alphabet, Coca-Cola, Monster Beverage—all began as under-the-radar growth stories riding a massive trend. We’ve identified the next one: a profitable AI semiconductor play Wall Street is still overlooking. Go here for access to our full report.
Store Performance
Number of Stores
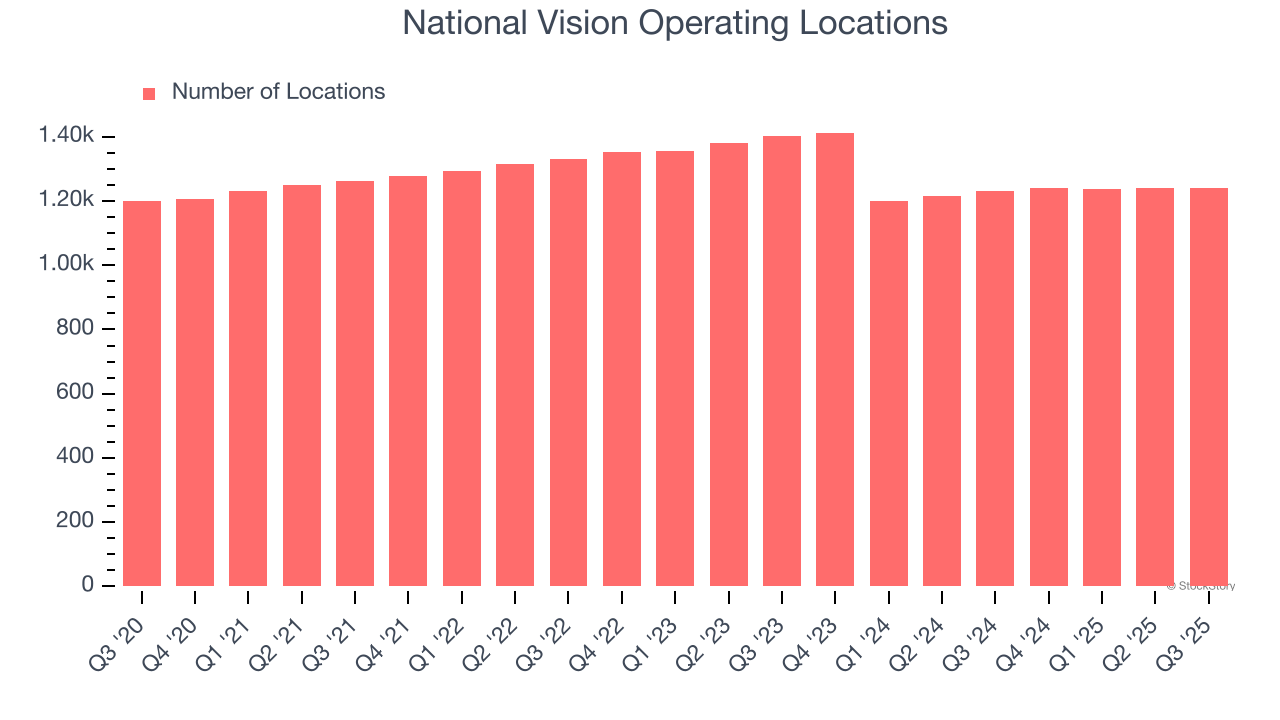
A retailer’s store count often determines how much revenue it can generate.
National Vision operated 1,242 locations in the latest quarter. Over the last two years, the company has generally closed its stores, averaging 4.7% annual declines.
When a retailer shutters stores, it usually means that brick-and-mortar demand is less than supply, and it is responding by closing underperforming locations to improve profitability.
Same-Store Sales
The change in a company's store base only tells one side of the story. The other is the performance of its existing locations and e-commerce sales, which informs management teams whether they should expand or downsize their physical footprints. Same-store sales is an industry measure of whether revenue is growing at those existing stores and is driven by customer visits (often called traffic) and the average spending per customer (ticket).
National Vision’s demand has been spectacular for a retailer over the last two years. On average, the company has increased its same-store sales by an impressive 3.7% per year. Given its declining store base over the same period, this performance stems from a mixture of higher e-commerce sales and increased foot traffic at existing locations (closing stores can sometimes boost same-store sales).
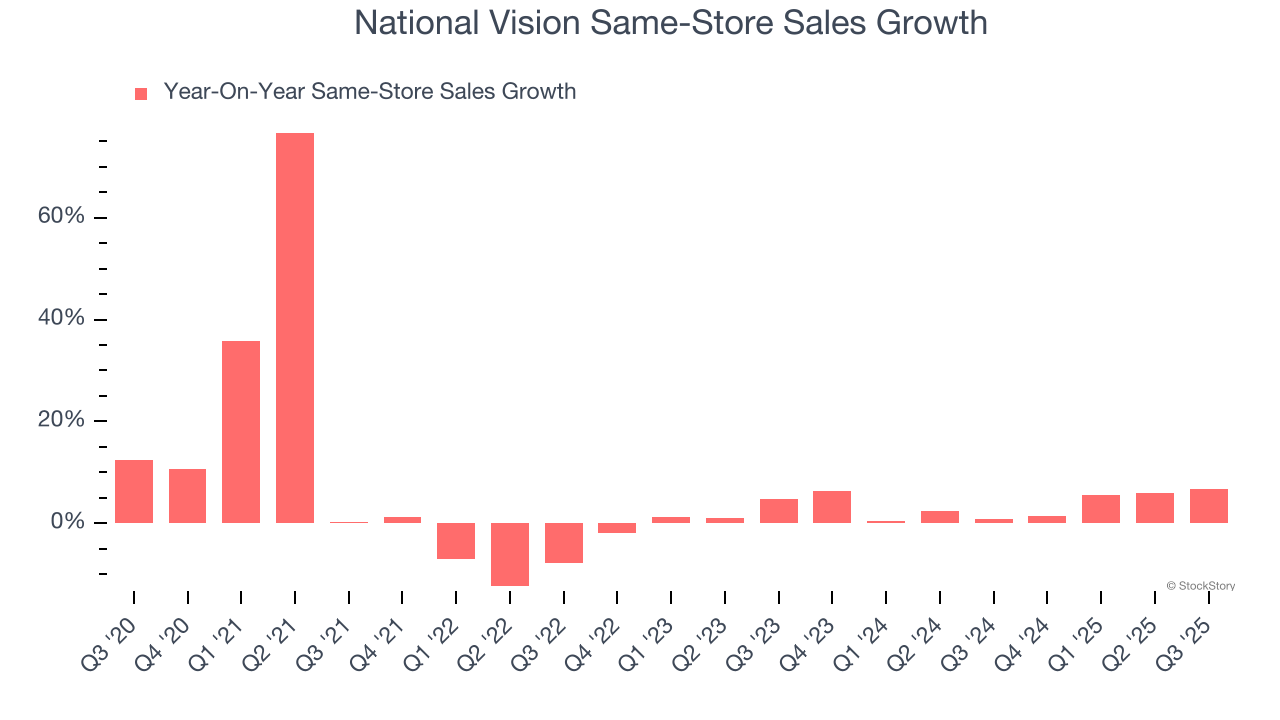
In the latest quarter, National Vision’s same-store sales rose 6.8% year on year. This growth was an acceleration from its historical levels, which is always an encouraging sign.
Key Takeaways from National Vision’s Q3 Results
We enjoyed seeing National Vision beat analysts’ revenue expectations this quarter. We were also glad its full-year revenue guidance slightly exceeded Wall Street’s estimates. On the other hand, its full-year EPS guidance missed. Overall, this was a mixed quarter. The stock traded up 4.9% to $26.88 immediately following the results.
Is National Vision an attractive investment opportunity right now? What happened in the latest quarter matters, but not as much as longer-term business quality and valuation, when deciding whether to invest in this stock. We cover that in our actionable full research report which you can read here, it’s free for active Edge members.


