
Healthcare diagnostics company QuidelOrtho (NASDAQ: QDEL) reported revenue ahead of Wall Streets expectations in Q3 CY2025, but sales fell by 3.7% year on year to $699.9 million. The company expects the full year’s revenue to be around $2.71 billion, close to analysts’ estimates. Its non-GAAP profit of $0.80 per share was 71.6% above analysts’ consensus estimates.
Is now the time to buy QuidelOrtho? Find out by accessing our full research report, it’s free for active Edge members.
QuidelOrtho (QDEL) Q3 CY2025 Highlights:
- Revenue: $699.9 million vs analyst estimates of $665.4 million (3.7% year-on-year decline, 5.2% beat)
- Adjusted EPS: $0.80 vs analyst estimates of $0.47 (71.6% beat)
- Adjusted EBITDA: $177.1 million vs analyst estimates of $139.5 million (25.3% margin, 27% beat)
- The company slightly lifted its revenue guidance for the full year to $2.71 billion at the midpoint from $2.71 billion
- Management lowered its full-year Adjusted EPS guidance to $2.08 at the midpoint, a 10.6% decrease
- EBITDA guidance for the full year is $595 million at the midpoint, in line with analyst expectations
- Operating Margin: -101%, down from 2.1% in the same quarter last year
- Constant Currency Revenue fell 4.6% year on year (-1.8% in the same quarter last year)
- Market Capitalization: $1.84 billion
Company Overview
Born from the 2022 merger of Quidel and Ortho Clinical Diagnostics, QuidelOrtho (NASDAQ: QDEL) develops and manufactures diagnostic testing solutions for healthcare providers, from rapid point-of-care tests to complex laboratory instruments and systems.
Revenue Growth
Examining a company’s long-term performance can provide clues about its quality. Any business can put up a good quarter or two, but the best consistently grow over the long haul. Unfortunately, QuidelOrtho struggled to consistently increase demand as its $2.71 billion of sales for the trailing 12 months was close to its revenue five years ago. This wasn’t a great result and suggests it’s a low quality business.
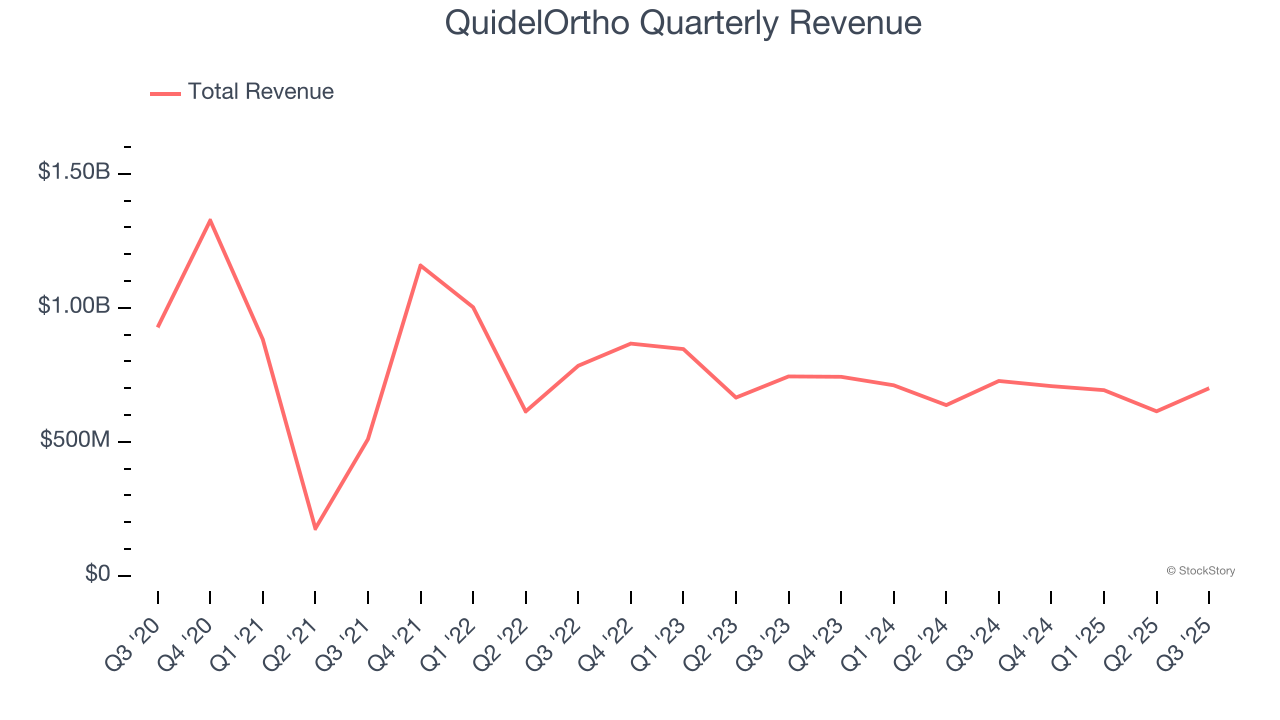
Long-term growth is the most important, but within healthcare, a half-decade historical view may miss new innovations or demand cycles. QuidelOrtho’s recent performance shows its demand remained suppressed as its revenue has declined by 6.8% annually over the last two years. 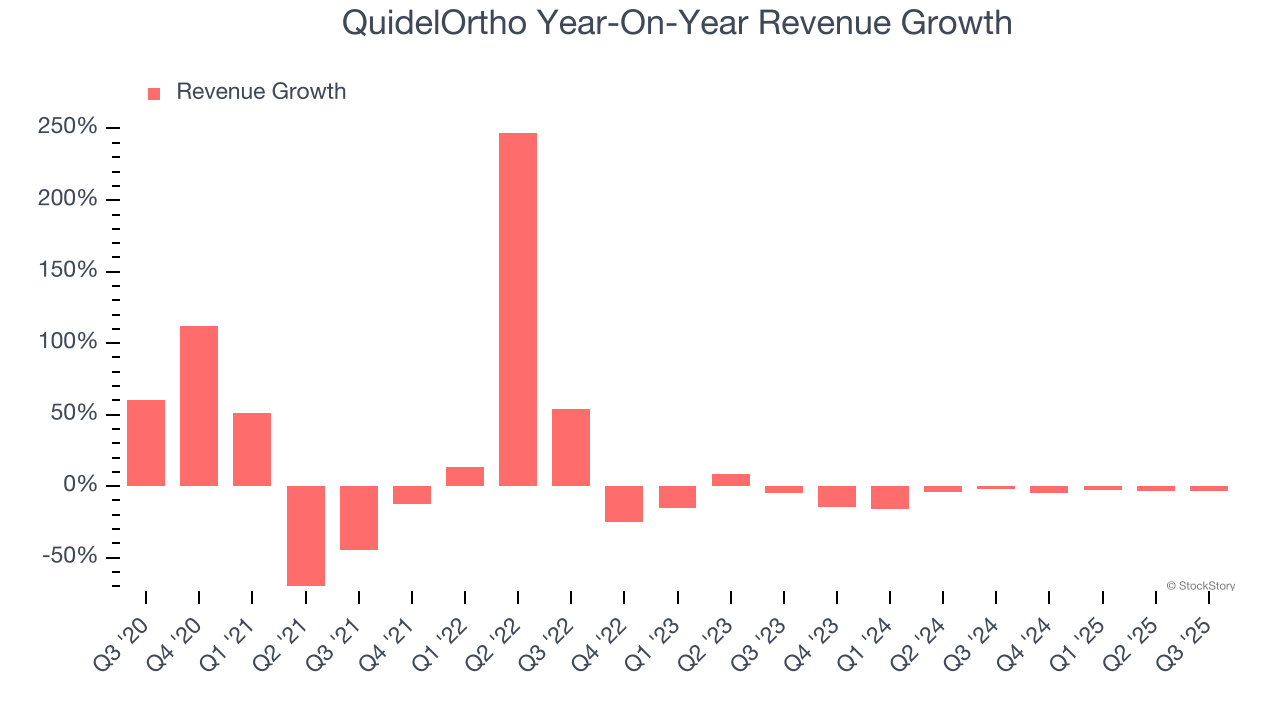
We can dig further into the company’s sales dynamics by analyzing its constant currency revenue, which excludes currency movements that are outside their control and not indicative of demand. Over the last two years, its constant currency sales averaged 6.1% year-on-year declines. Because this number aligns with its normal revenue growth, we can see that QuidelOrtho has properly hedged its foreign currency exposure. 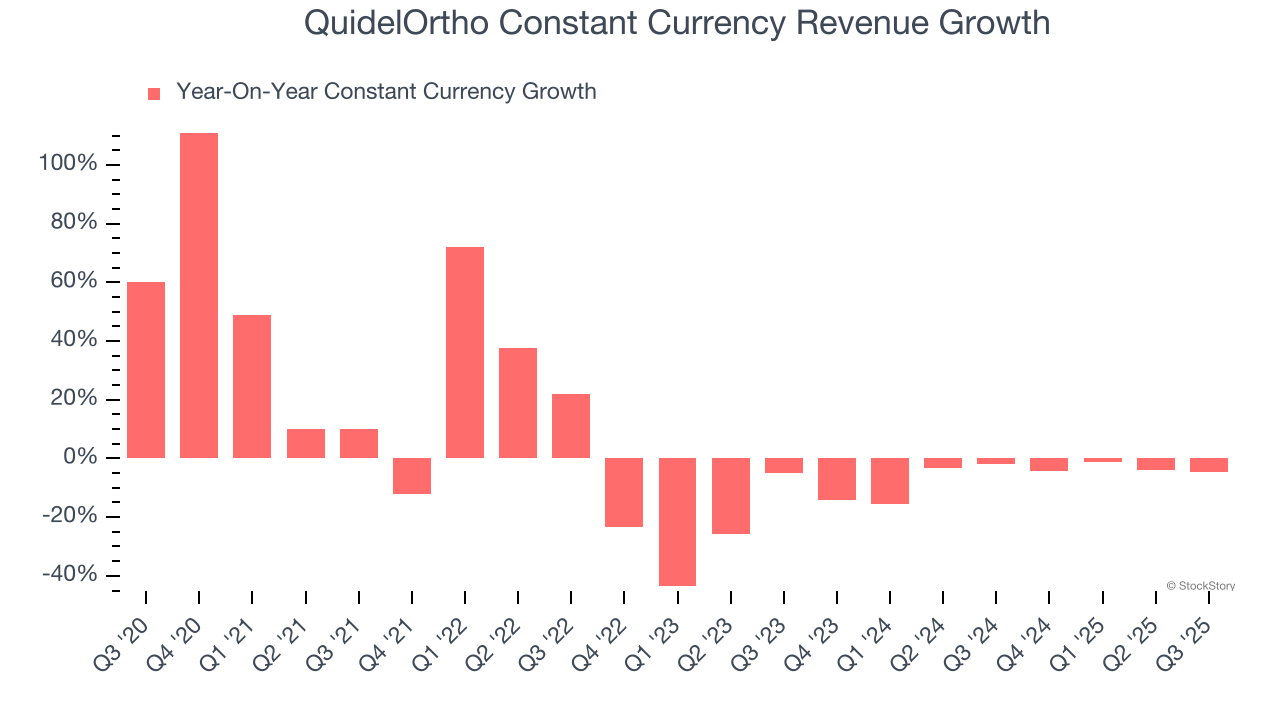
This quarter, QuidelOrtho’s revenue fell by 3.7% year on year to $699.9 million but beat Wall Street’s estimates by 5.2%.
Looking ahead, sell-side analysts expect revenue to grow 1.5% over the next 12 months. While this projection implies its newer products and services will catalyze better top-line performance, it is still below the sector average.
While Wall Street chases Nvidia at all-time highs, an under-the-radar semiconductor supplier is dominating a critical AI component these giants can’t build without. Click here to access our free report one of our favorites growth stories.
Operating Margin
Operating margin is an important measure of profitability as it shows the portion of revenue left after accounting for all core expenses – everything from the cost of goods sold to advertising and wages. It’s also useful for comparing profitability across companies with different levels of debt and tax rates because it excludes interest and taxes.
QuidelOrtho’s high expenses have contributed to an average operating margin of negative 1.5% over the last five years. Unprofitable healthcare companies require extra attention because they could get caught swimming naked when the tide goes out. It’s hard to trust that the business can endure a full cycle.
Analyzing the trend in its profitability, QuidelOrtho’s operating margin decreased by 76.7 percentage points over the last five years. The company’s two-year trajectory also shows it failed to get its profitability back to the peak as its margin fell by 41.1 percentage points. This performance was poor no matter how you look at it - it shows its expenses were rising and it couldn’t pass those costs onto its customers.
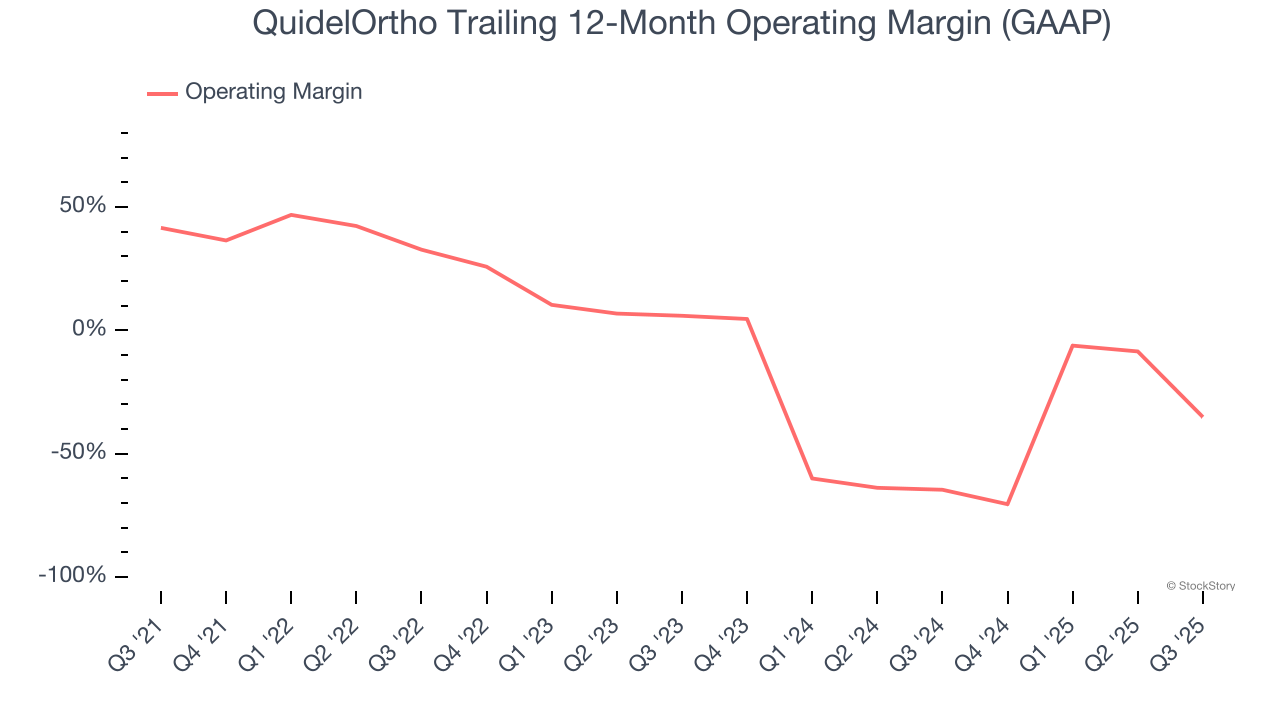
This quarter, QuidelOrtho generated a negative 101% operating margin. The company's consistent lack of profits raise a flag.
Earnings Per Share
Revenue trends explain a company’s historical growth, but the long-term change in earnings per share (EPS) points to the profitability of that growth – for example, a company could inflate its sales through excessive spending on advertising and promotions.
Sadly for QuidelOrtho, its EPS declined by 25.3% annually over the last five years while its revenue was flat. This tells us the company struggled because its fixed cost base made it difficult to adjust to choppy demand.
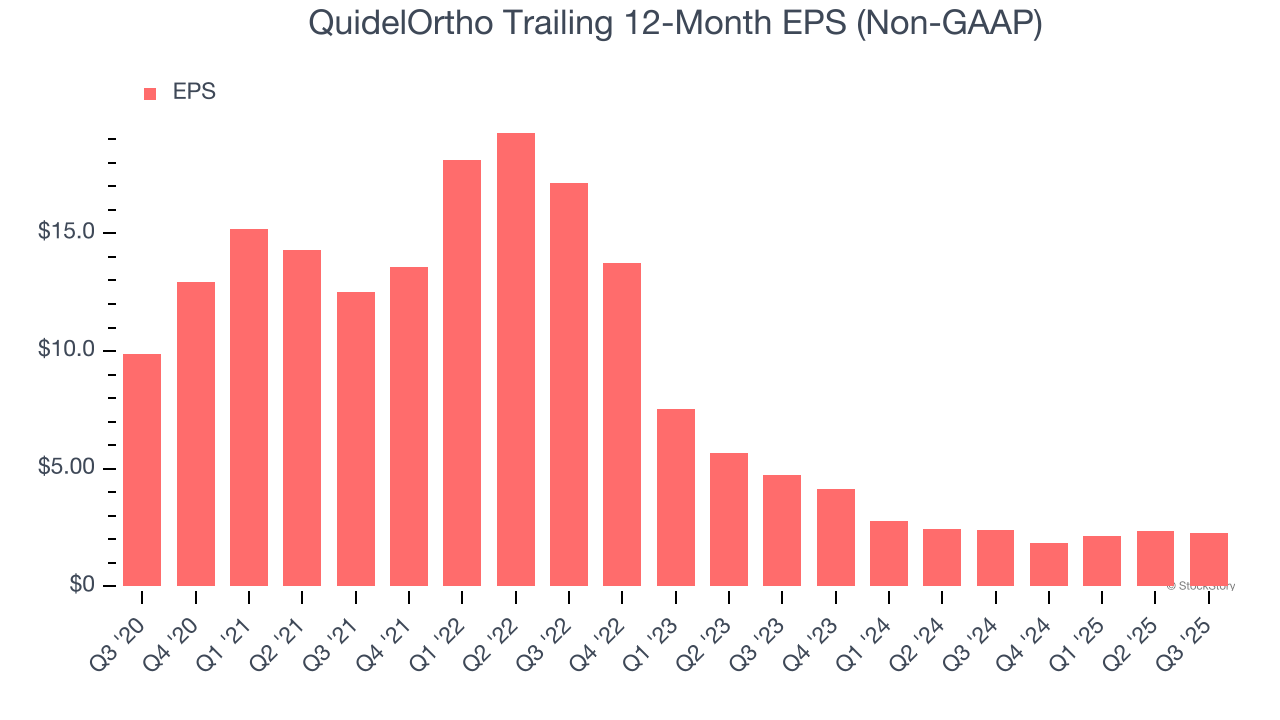
Diving into the nuances of QuidelOrtho’s earnings can give us a better understanding of its performance. As we mentioned earlier, QuidelOrtho’s operating margin declined by 76.7 percentage points over the last five years. Its share count also grew by 56%, meaning the company not only became less efficient with its operating expenses but also diluted its shareholders. 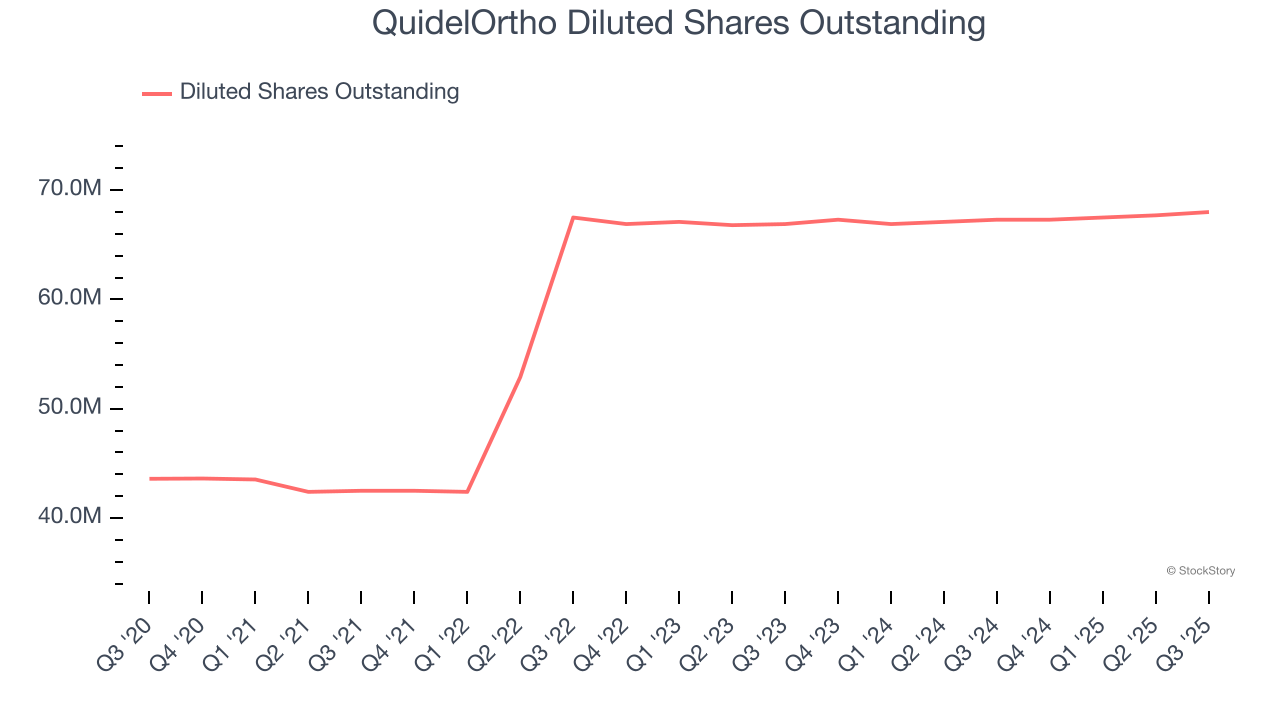
In Q3, QuidelOrtho reported adjusted EPS of $0.80, down from $0.85 in the same quarter last year. Despite falling year on year, this print easily cleared analysts’ estimates. Over the next 12 months, Wall Street expects QuidelOrtho’s full-year EPS of $2.29 to grow 19.3%.
Key Takeaways from QuidelOrtho’s Q3 Results
We were impressed by how significantly QuidelOrtho blew past analysts’ constant currency revenue expectations this quarter. We were also glad its EPS outperformed Wall Street’s estimates. On the other hand, its full-year EPS guidance missed. Overall, we think this was still a solid quarter with some key areas of upside. The stock traded up 4% to $28.49 immediately after reporting.
Indeed, QuidelOrtho had a rock-solid quarterly earnings result, but is this stock a good investment here? The latest quarter does matter, but not nearly as much as longer-term fundamentals and valuation, when deciding if the stock is a buy. We cover that in our actionable full research report which you can read here, it’s free for active Edge members.


