Solar power systems company SolarEdge (NASDAQ: SEDG) reported Q3 CY2025 results topping the market’s revenue expectations, with sales up 44.5% year on year to $340.2 million. On the other hand, next quarter’s revenue guidance of $325 million was less impressive, coming in 4.7% below analysts’ estimates. Its non-GAAP loss of $0.31 per share was 26.8% above analysts’ consensus estimates.
Is now the time to buy SolarEdge? Find out by accessing our full research report, it’s free for active Edge members.
SolarEdge (SEDG) Q3 CY2025 Highlights:
- Revenue: $340.2 million vs analyst estimates of $334.5 million (44.5% year-on-year growth, 1.7% beat)
- Adjusted EPS: -$0.31 vs analyst estimates of -$0.42 (26.8% beat)
- Adjusted EBITDA: -$27.95 million vs analyst estimates of -$20.82 million (-8.2% margin, 34.2% miss)
- Revenue Guidance for Q4 CY2025 is $325 million at the midpoint, below analyst estimates of $340.9 million
- Operating Margin: -10.3%, up from -472% in the same quarter last year
- Free Cash Flow was -$2.81 million compared to -$136.7 million in the same quarter last year
- Megawatts Shipped: 1,471, up 621 year on year
- Market Capitalization: $1.89 billion
“We’re making steady progress in our turnaround, with three consecutive quarters of revenue growth and improving margins, and we’re not done yet,” said Shuki Nir, CEO of SolarEdge.
Company Overview
Established in 2006, SolarEdge (NASDAQ: SEDG) creates advanced systems to improve the efficiency of solar panels.
Revenue Growth
Examining a company’s long-term performance can provide clues about its quality. Any business can have short-term success, but a top-tier one grows for years. SolarEdge struggled to consistently generate demand over the last five years as its sales dropped at a 7.2% annual rate. This wasn’t a great result and suggests it’s a low quality business.
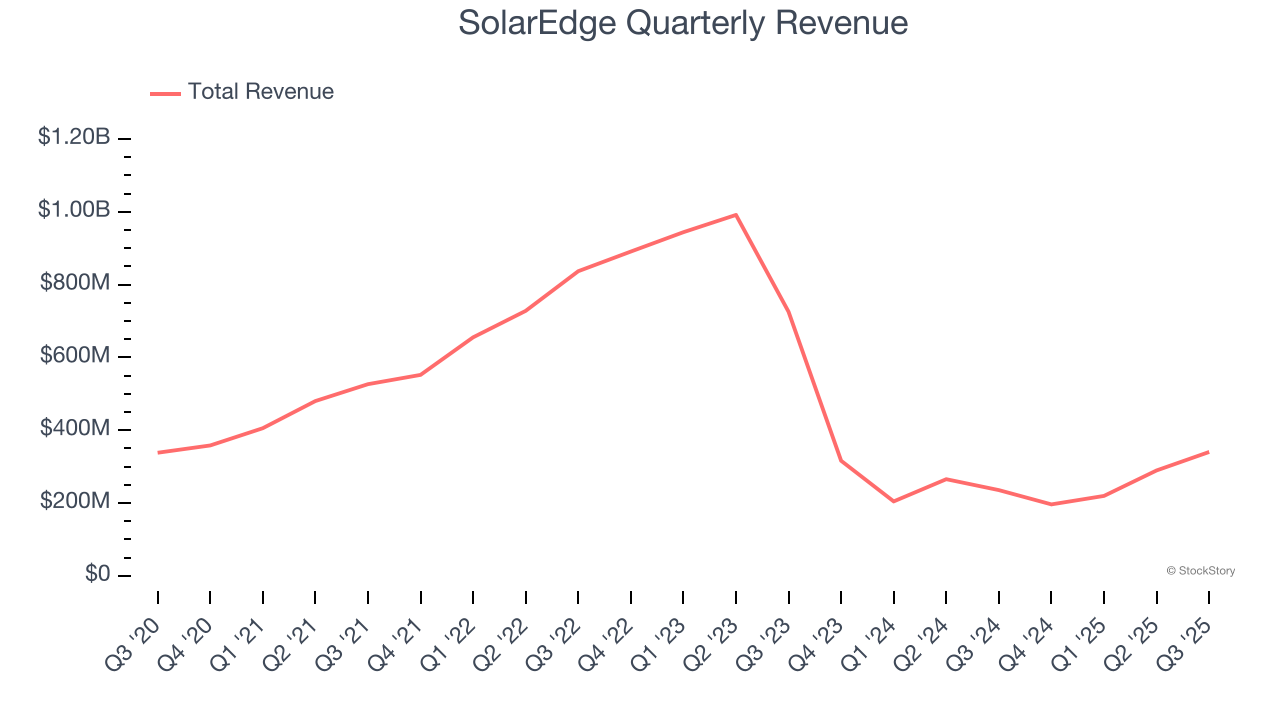
Long-term growth is the most important, but within industrials, a half-decade historical view may miss new industry trends or demand cycles. SolarEdge’s recent performance shows its demand remained suppressed as its revenue has declined by 45.7% annually over the last two years. 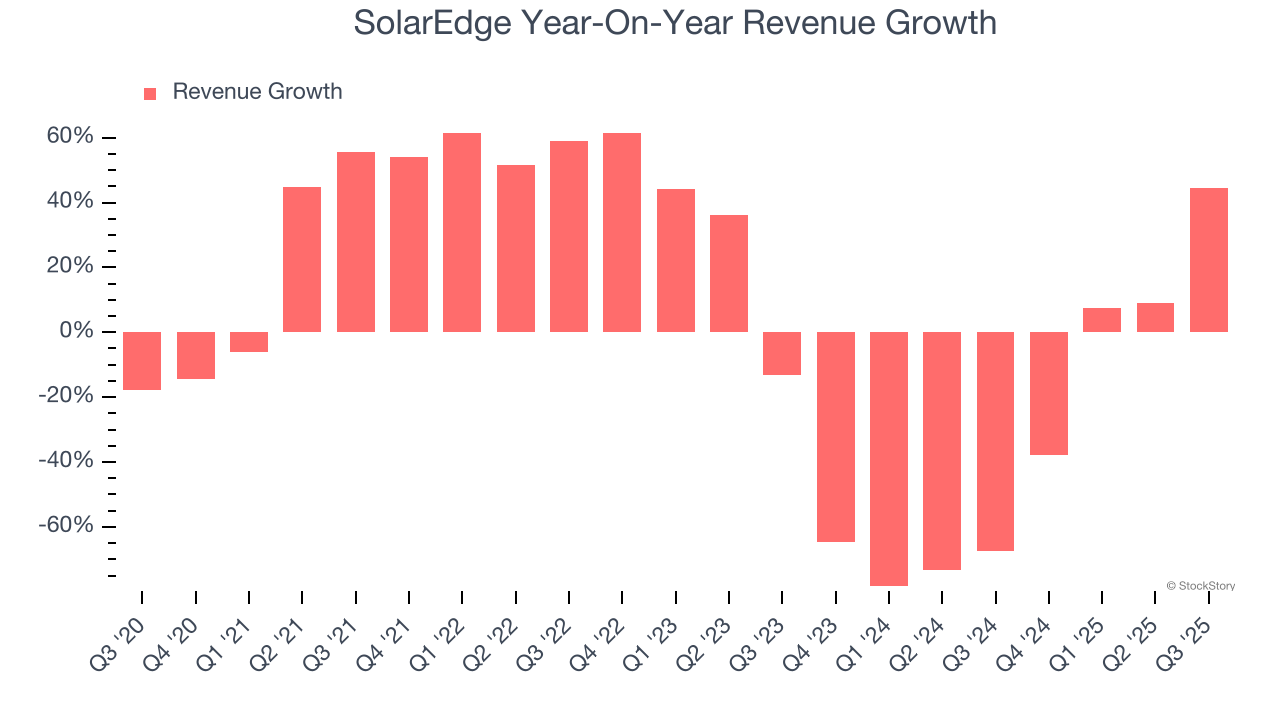
SolarEdge also discloses its number of megawatts shipped, which reached 1,471 in the latest quarter. Over the last two years, SolarEdge’s megawatts shipped averaged 20.7% year-on-year declines. Because this number is higher than its revenue growth during the same period, we can see the company’s monetization has fallen. 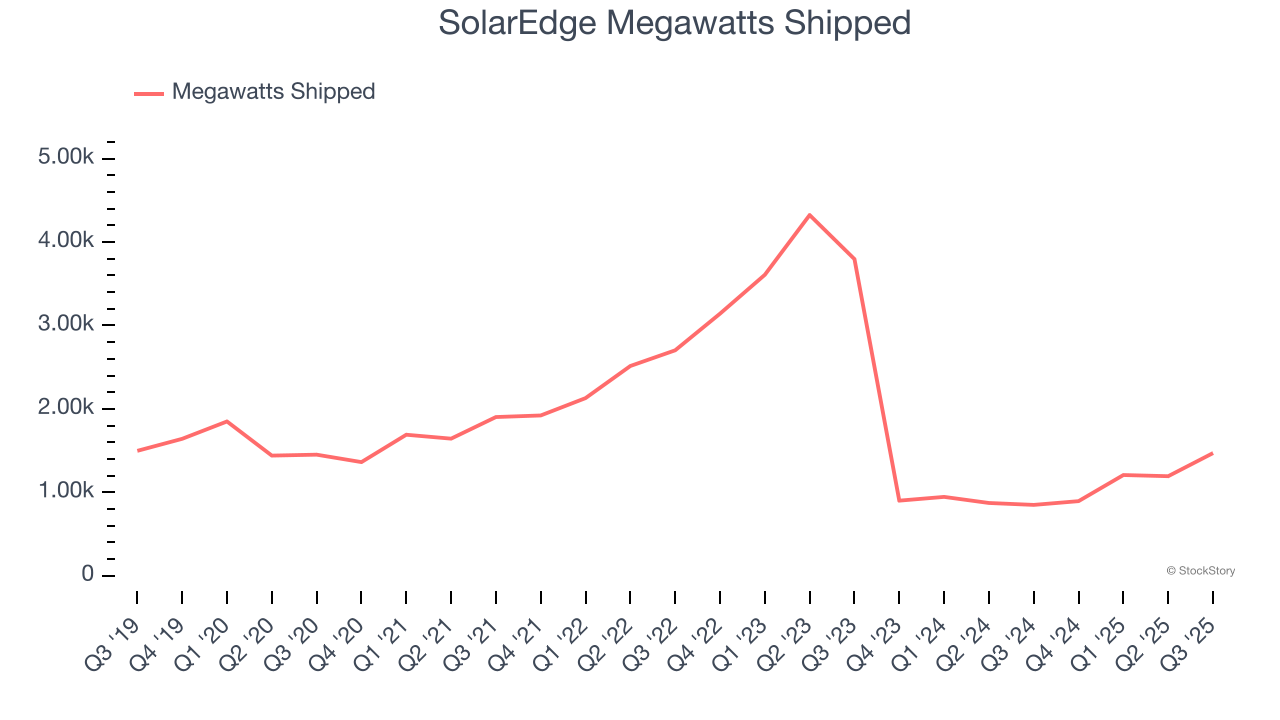
This quarter, SolarEdge reported magnificent year-on-year revenue growth of 44.5%, and its $340.2 million of revenue beat Wall Street’s estimates by 1.7%. Company management is currently guiding for a 65.6% year-on-year increase in sales next quarter.
Looking further ahead, sell-side analysts expect revenue to grow 29.4% over the next 12 months, an improvement versus the last two years. This projection is eye-popping and suggests its newer products and services will fuel better top-line performance.
Software is eating the world and there is virtually no industry left that has been untouched by it. That drives increasing demand for tools helping software developers do their jobs, whether it be monitoring critical cloud infrastructure, integrating audio and video functionality, or ensuring smooth content streaming. Click here to access a free report on our 3 favorite stocks to play this generational megatrend.
Operating Margin
SolarEdge’s high expenses have contributed to an average operating margin of negative 15.1% over the last five years. Unprofitable industrials companies require extra attention because they could get caught swimming naked when the tide goes out. It’s hard to trust that the business can endure a full cycle.
Analyzing the trend in its profitability, SolarEdge’s operating margin decreased by 59.7 percentage points over the last five years. SolarEdge’s performance was poor no matter how you look at it - it shows that costs were rising and it couldn’t pass them onto its customers.
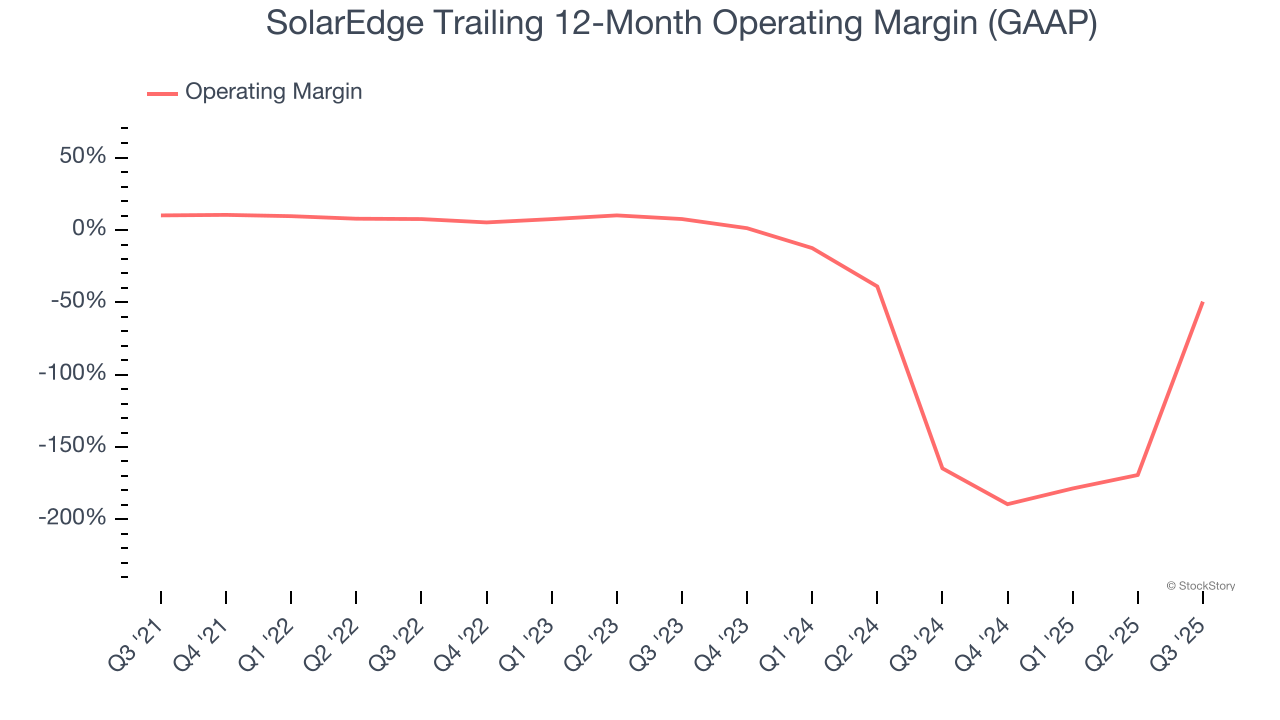
SolarEdge’s operating margin was negative 10.3% this quarter. The company's consistent lack of profits raise a flag.
Earnings Per Share
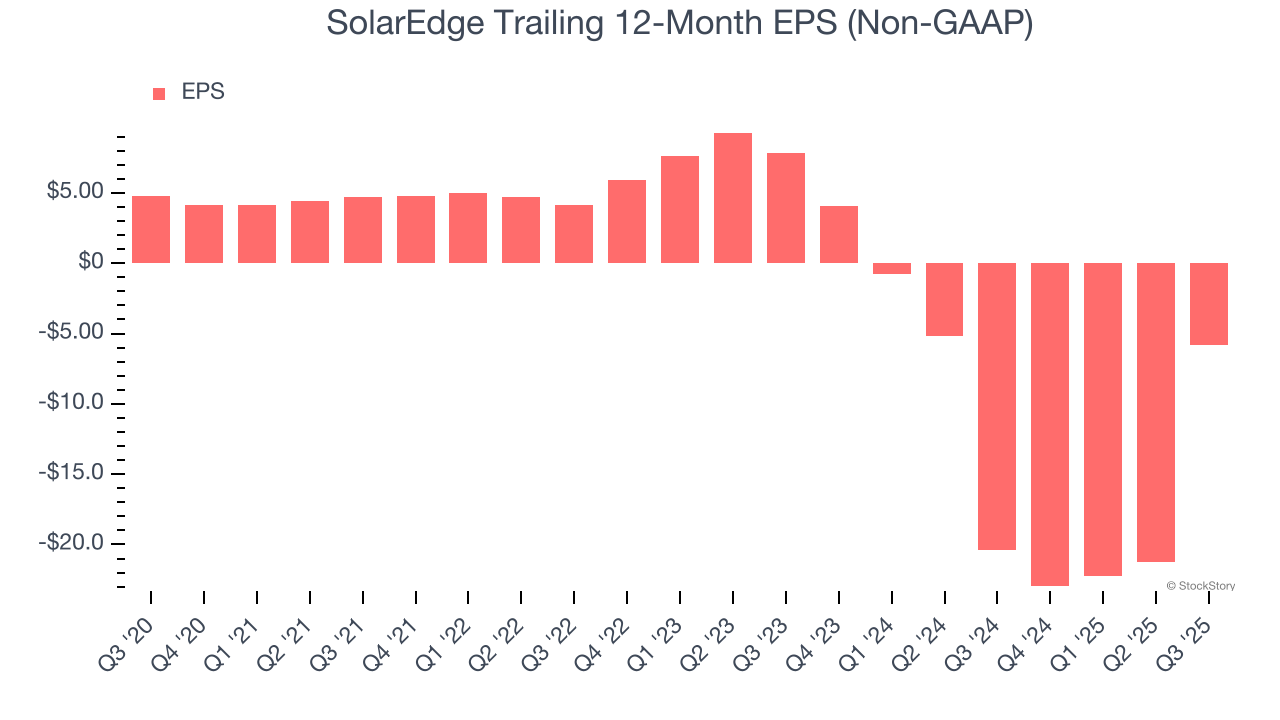
We track the long-term change in earnings per share (EPS) for the same reason as long-term revenue growth. Compared to revenue, however, EPS highlights whether a company’s growth is profitable.
Sadly for SolarEdge, its EPS declined by 26.2% annually over the last five years, more than its revenue. This tells us the company struggled because its fixed cost base made it difficult to adjust to shrinking demand.
Diving into the nuances of SolarEdge’s earnings can give us a better understanding of its performance. As we mentioned earlier, SolarEdge’s operating margin expanded this quarter but declined by 59.7 percentage points over the last five years. Its share count also grew by 11.5%, meaning the company not only became less efficient with its operating expenses but also diluted its shareholders. 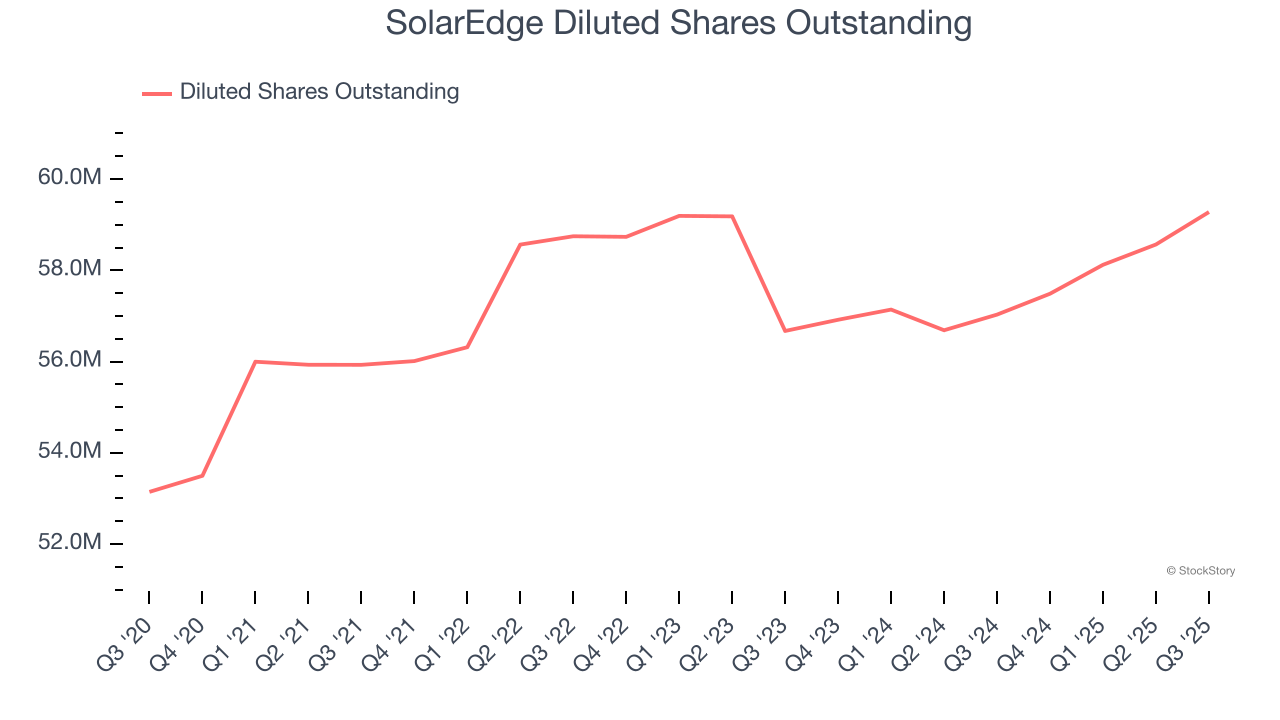
Like with revenue, we analyze EPS over a shorter period to see if we are missing a change in the business.
For SolarEdge, its two-year annual EPS declines of 65.5% show it’s continued to underperform. These results were bad no matter how you slice the data.
In Q3, SolarEdge reported adjusted EPS of negative $0.31, up from negative $15.78 in the same quarter last year. This print easily cleared analysts’ estimates, and shareholders should be content with the results. Over the next 12 months, Wall Street expects SolarEdge to improve its earnings losses. Analysts forecast its full-year EPS of negative $5.78 will advance to negative $0.32.
Key Takeaways from SolarEdge’s Q3 Results
It was good to see SolarEdge beat analysts’ EPS expectations this quarter. We were also happy its revenue outperformed Wall Street’s estimates. On the other hand, its EBITDA missed and its revenue guidance for next quarter fell short of Wall Street’s estimates. Overall, this was a softer quarter. The stock traded down 8.3% to $29.19 immediately following the results.
The latest quarter from SolarEdge’s wasn’t that good. One earnings report doesn’t define a company’s quality, though, so let’s explore whether the stock is a buy at the current price. When making that decision, it’s important to consider its valuation, business qualities, as well as what has happened in the latest quarter. We cover that in our actionable full research report which you can read here, it’s free for active Edge members.