
Cloud reporting platform Workiva (NYSE: WK) reported Q3 CY2025 results exceeding the market’s revenue expectations, with sales up 20.8% year on year to $224.2 million. Guidance for next quarter’s revenue was better than expected at $235 million at the midpoint, 1.6% above analysts’ estimates. Its non-GAAP profit of $0.55 per share was 42.7% above analysts’ consensus estimates.
Is now the time to buy Workiva? Find out by accessing our full research report, it’s free for active Edge members.
Workiva (WK) Q3 CY2025 Highlights:
- Revenue: $224.2 million vs analyst estimates of $219 million (20.8% year-on-year growth, 2.4% beat)
- Adjusted EPS: $0.55 vs analyst estimates of $0.39 (42.7% beat)
- Adjusted Operating Income: $28.5 million vs analyst estimates of $16.83 million (12.7% margin, 69.3% beat)
- Revenue Guidance for Q4 CY2025 is $235 million at the midpoint, above analyst estimates of $231.2 million
- Management raised its full-year Adjusted EPS guidance to $1.67 at the midpoint, a 23.8% increase
- Operating Margin: -1.5%, up from -11.7% in the same quarter last year
- Free Cash Flow Margin: 20.5%, down from 22.9% in the previous quarter
- Customers: 6,541, up from 6,467 in the previous quarter
- Net Revenue Retention Rate: 114%, in line with the previous quarter
- Billings: $260 million at quarter end, up 20.6% year on year
- Market Capitalization: $4.59 billion
Company Overview
Nicknamed "the Excel killer" by some finance professionals for its ability to eliminate spreadsheet chaos, Workiva (NYSE: WK) provides a cloud-based platform that enables organizations to streamline financial reporting, ESG, and compliance processes with connected data and automation.
Revenue Growth
Examining a company’s long-term performance can provide clues about its quality. Any business can put up a good quarter or two, but many enduring ones grow for years. Luckily, Workiva’s sales grew at a decent 20.1% compounded annual growth rate over the last five years. Its growth was slightly above the average software company and shows its offerings resonate with customers.
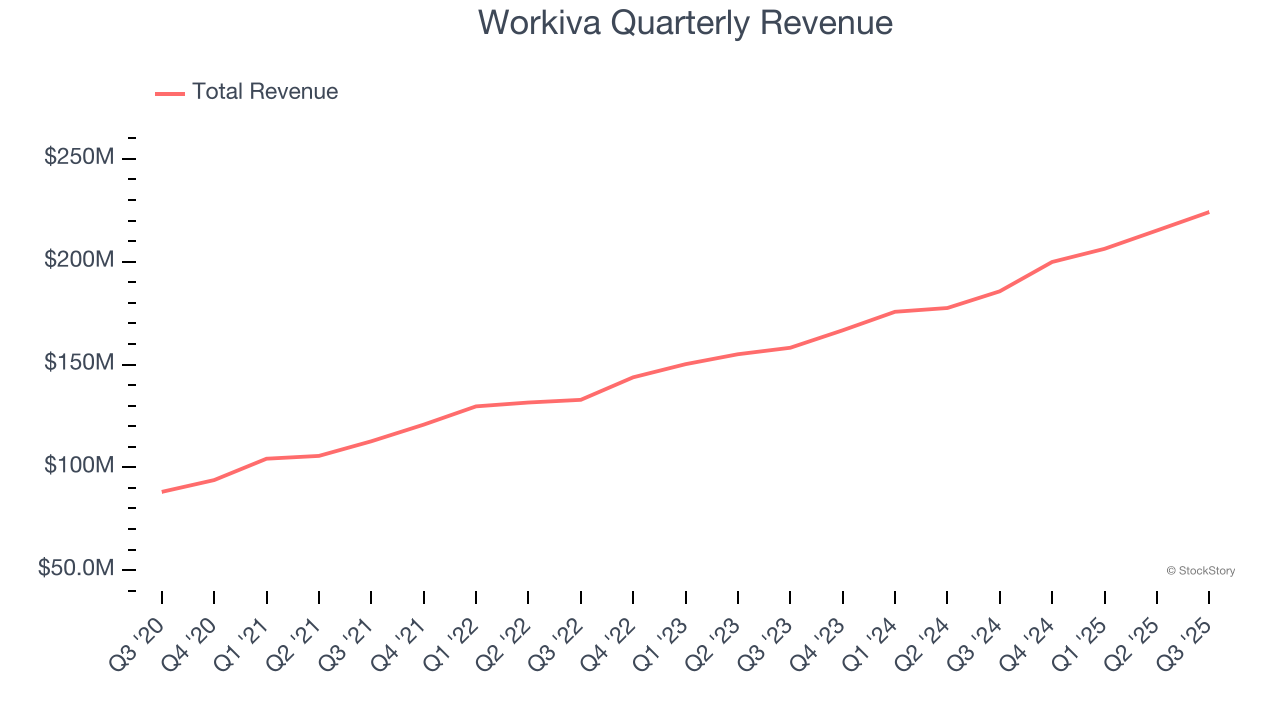
Long-term growth is the most important, but within software, a half-decade historical view may miss new innovations or demand cycles. Workiva’s annualized revenue growth of 18% over the last two years is below its five-year trend, but we still think the results were good. 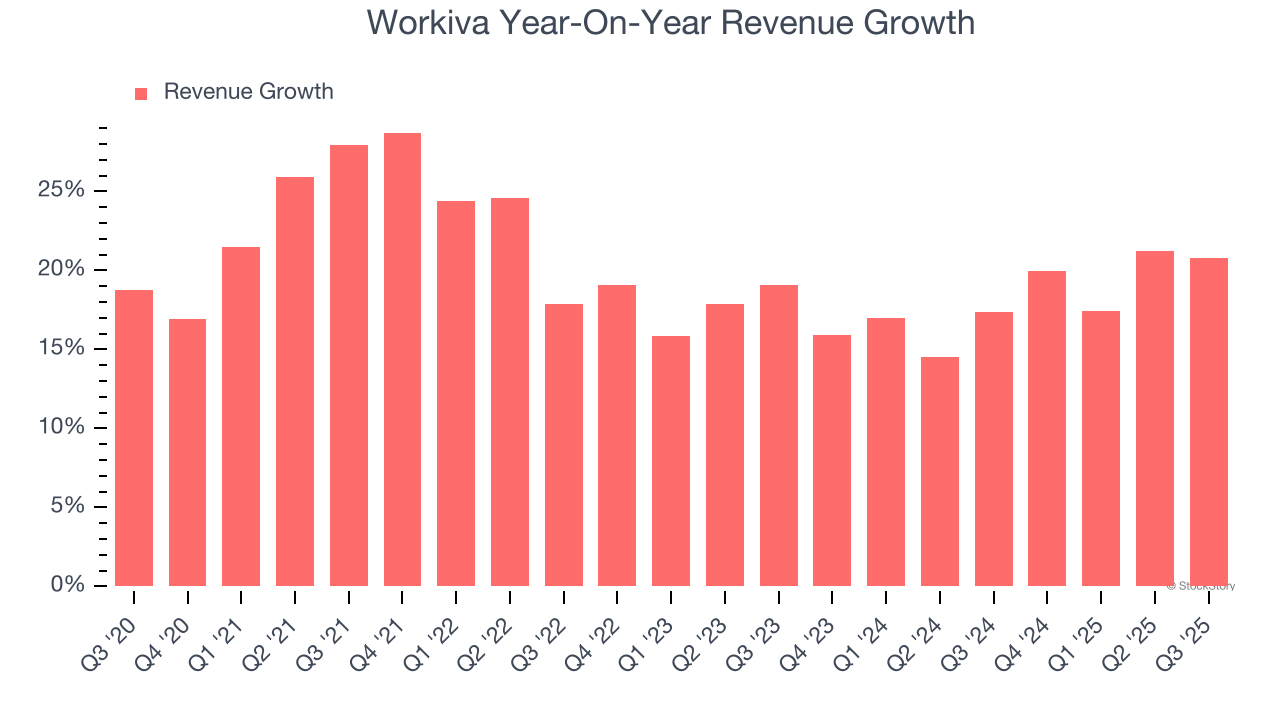
This quarter, Workiva reported robust year-on-year revenue growth of 20.8%, and its $224.2 million of revenue topped Wall Street estimates by 2.4%. Company management is currently guiding for a 17.6% year-on-year increase in sales next quarter.
Looking further ahead, sell-side analysts expect revenue to grow 14.9% over the next 12 months, a deceleration versus the last two years. This projection is underwhelming and indicates its products and services will see some demand headwinds.
While Wall Street chases Nvidia at all-time highs, an under-the-radar semiconductor supplier is dominating a critical AI component these giants can’t build without. Click here to access our free report one of our favorites growth stories.
Billings
Billings is a non-GAAP metric that is often called “cash revenue” because it shows how much money the company has collected from customers in a certain period. This is different from revenue, which must be recognized in pieces over the length of a contract.
Workiva’s billings punched in at $260 million in Q3, and over the last four quarters, its growth was impressive as it averaged 21.2% year-on-year increases. This performance aligned with its total sales growth, indicating robust customer demand. The high level of cash collected from customers also enhances liquidity and provides a solid foundation for future investments and growth. 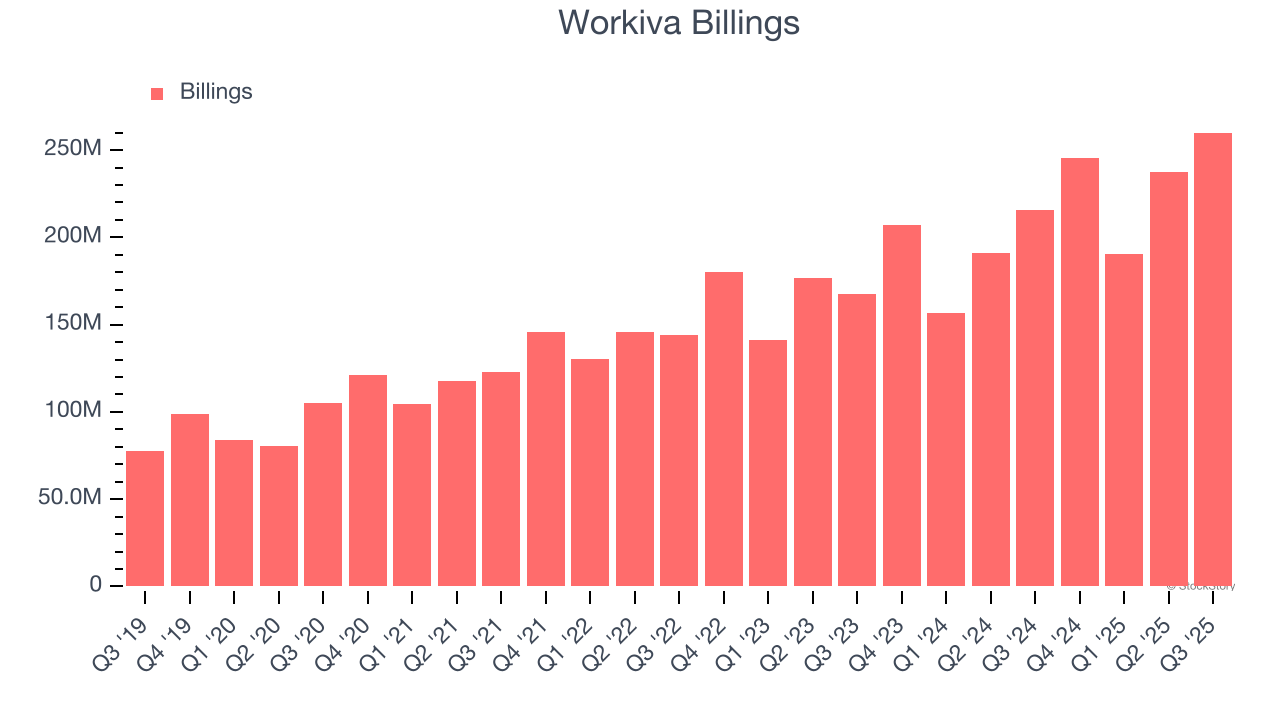
Customer Retention
One of the best parts about the software-as-a-service business model (and a reason why they trade at high valuation multiples) is that customers typically spend more on a company’s products and services over time.
Workiva’s net revenue retention rate, a key performance metric measuring how much money existing customers from a year ago are spending today, was 113% in Q3. This means Workiva would’ve grown its revenue by 12.5% even if it didn’t win any new customers over the last 12 months.
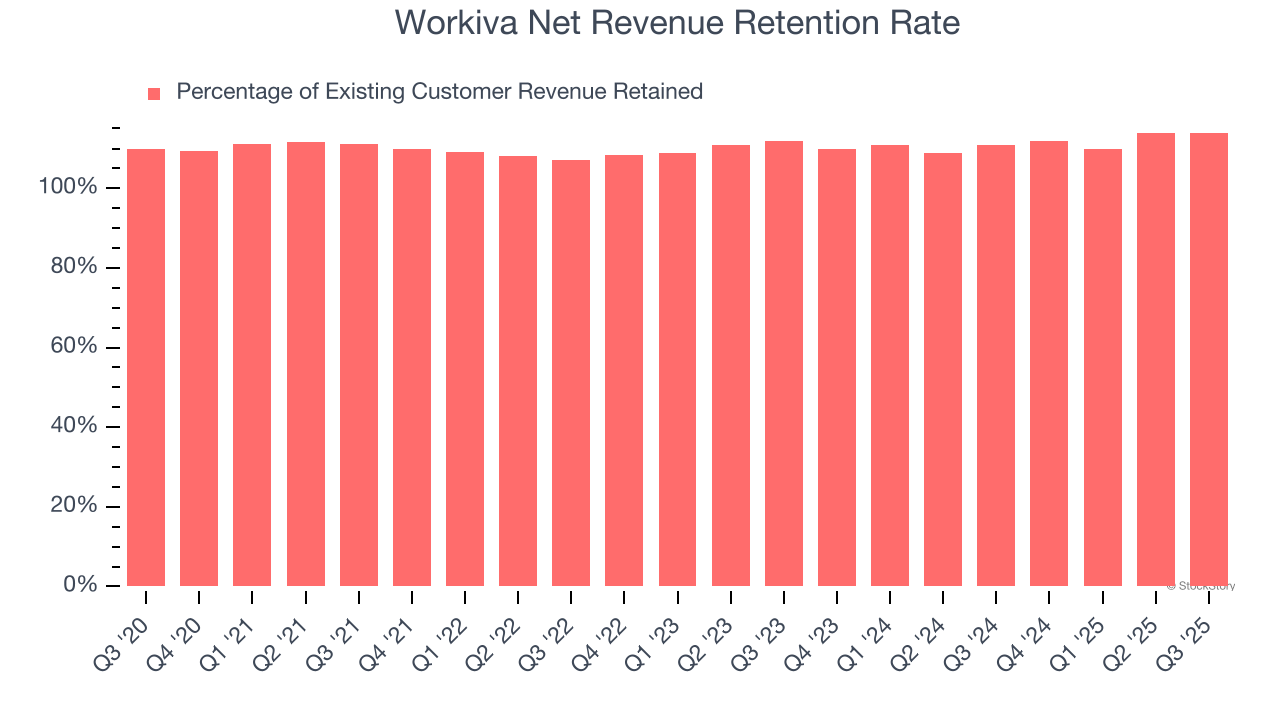
Trending up over the last year, Workiva has a good net retention rate, proving that customers are satisfied with its software and getting more value from it over time, which is always great to see.
Key Takeaways from Workiva’s Q3 Results
We were impressed by how significantly Workiva blew past analysts’ billings expectations this quarter. We were also glad its EPS guidance for next quarter trumped Wall Street’s estimates. Overall, we think this was still a solid quarter with some key areas of upside. The stock traded up 7.1% to $88.02 immediately after reporting.
Workiva put up rock-solid earnings, but one quarter doesn’t necessarily make the stock a buy. Let’s see if this is a good investment. If you’re making that decision, you should consider the bigger picture of valuation, business qualities, as well as the latest earnings. We cover that in our actionable full research report which you can read here, it’s free for active Edge members.


