
Luxury furniture retailer Arhaus (NASDAQ: ARHS) announced better-than-expected revenue in Q3 CY2025, with sales up 8% year on year to $344.6 million. Guidance for next quarter’s revenue was optimistic at $351 million at the midpoint, 2% above analysts’ estimates. Its GAAP profit of $0.09 per share was in line with analysts’ consensus estimates.
Is now the time to buy Arhaus? Find out by accessing our full research report, it’s free for active Edge members.
Arhaus (ARHS) Q3 CY2025 Highlights:
- Revenue: $344.6 million vs analyst estimates of $337.7 million (8% year-on-year growth, 2% beat)
- EPS (GAAP): $0.09 vs analyst estimates of $0.08 (in line)
- Adjusted EBITDA: $31.24 million vs analyst estimates of $29.46 million (9.1% margin, 6% beat)
- Revenue Guidance for Q4 CY2025 is $351 million at the midpoint, above analyst estimates of $344.1 million
- EBITDA guidance for the full year is $140 million at the midpoint, in line with analyst expectations
- Operating Margin: 4.8%, up from 3.3% in the same quarter last year
- Free Cash Flow Margin: 8.1%, up from 1.4% in the same quarter last year
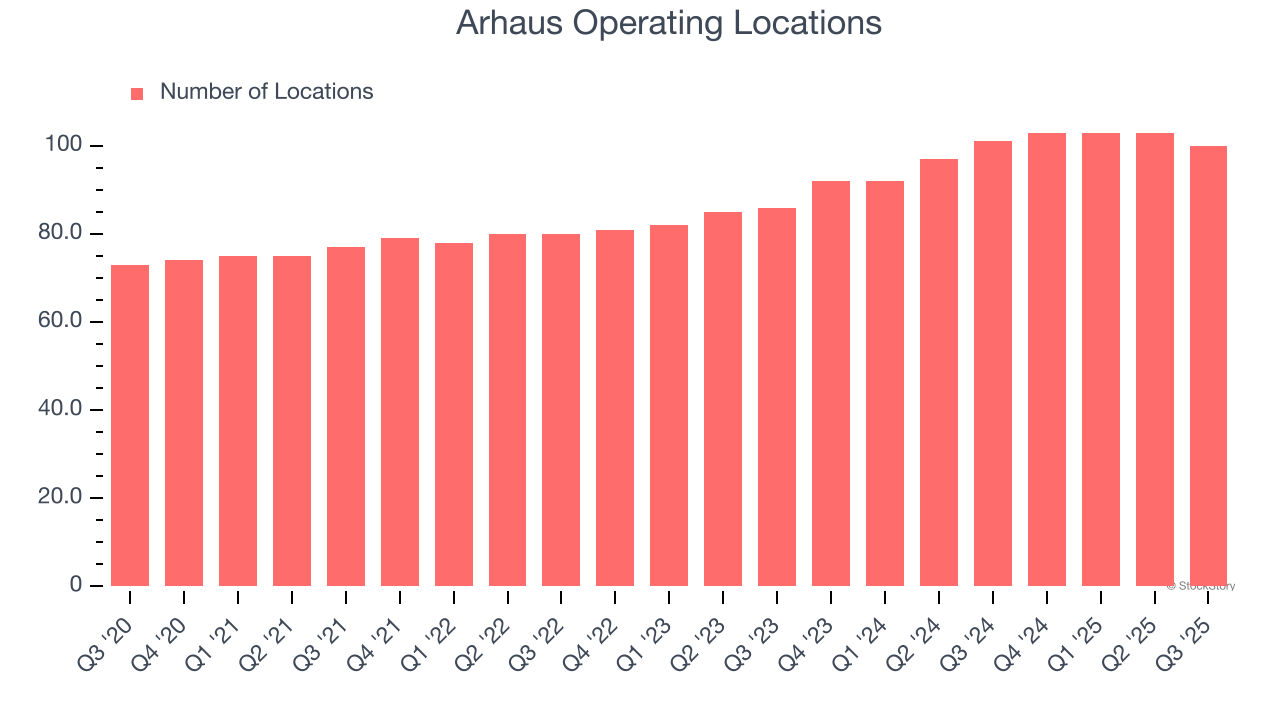
- Locations: 100 at quarter end, down from 101 in the same quarter last year
- Same-Store Sales rose 4.1% year on year (-9.2% in the same quarter last year)
- Market Capitalization: $1.38 billion
Company Overview
With an aesthetic that features natural materials such as reclaimed wood, Arhaus (NASDAQ: ARHS) is a high-end furniture retailer that sells everything from sofas to rugs to bookcases.
Revenue Growth
A company’s long-term sales performance can indicate its overall quality. Any business can put up a good quarter or two, but the best consistently grow over the long haul.
With $1.36 billion in revenue over the past 12 months, Arhaus is a small retailer, which sometimes brings disadvantages compared to larger competitors benefiting from economies of scale and negotiating leverage with suppliers. On the bright side, it can grow faster because it has more white space to build new stores.
As you can see below, Arhaus’s sales grew at an excellent 18.8% compounded annual growth rate over the last six years (we compare to 2019 to normalize for COVID-19 impacts) as it opened new stores and expanded its reach.
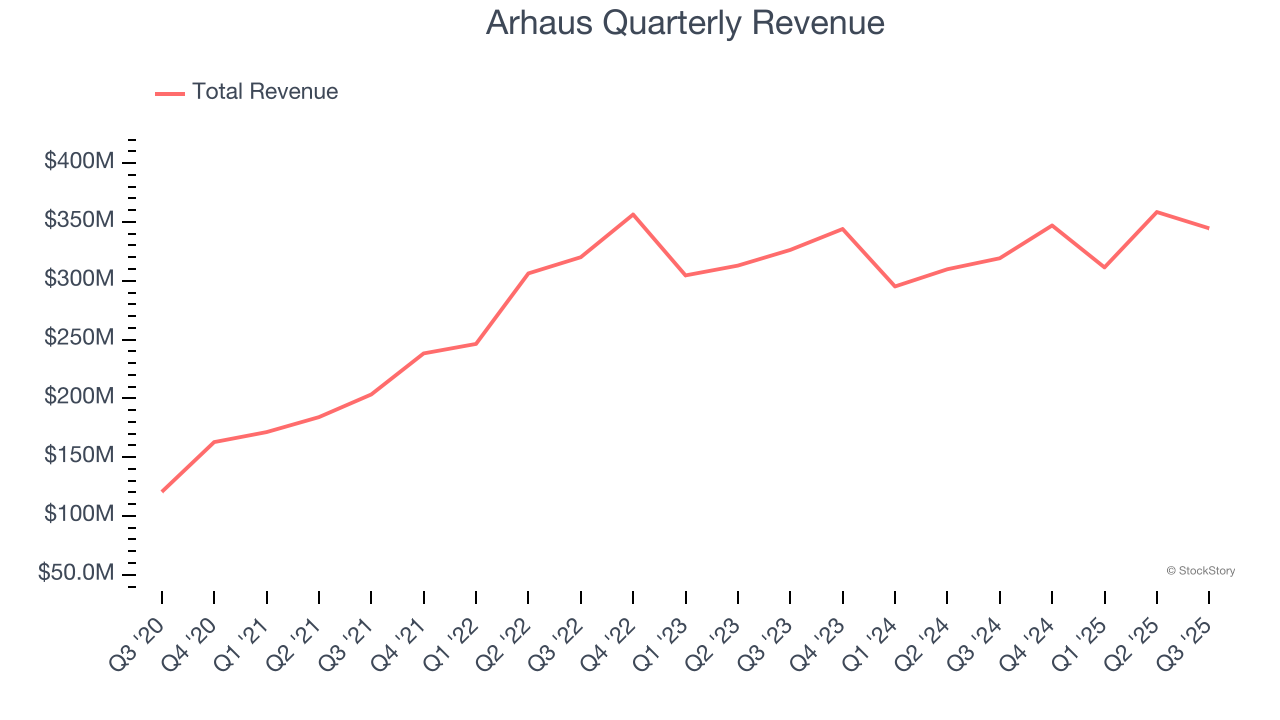
This quarter, Arhaus reported year-on-year revenue growth of 8%, and its $344.6 million of revenue exceeded Wall Street’s estimates by 2%. Company management is currently guiding for a 1.1% year-on-year increase in sales next quarter.
Looking further ahead, sell-side analysts expect revenue to grow 4.3% over the next 12 months, a deceleration versus the last six years. Still, this projection is above average for the sector and implies the market is forecasting some success for its newer products.
The 1999 book Gorilla Game predicted Microsoft and Apple would dominate tech before it happened. Its thesis? Identify the platform winners early. Today, enterprise software companies embedding generative AI are becoming the new gorillas. a profitable, fast-growing enterprise software stock that is already riding the automation wave and looking to catch the generative AI next.
Store Performance
Number of Stores
A retailer’s store count influences how much it can sell and how quickly revenue can grow.
Arhaus operated 100 locations in the latest quarter. It has opened new stores at a rapid clip over the last two years, averaging 10.8% annual growth, much faster than the broader consumer retail sector. This gives it a chance to scale into a mid-sized business over time.
When a retailer opens new stores, it usually means it’s investing for growth because demand is greater than supply, especially in areas where consumers may not have a store within reasonable driving distance.
Same-Store Sales
The change in a company's store base only tells one side of the story. The other is the performance of its existing locations and e-commerce sales, which informs management teams whether they should expand or downsize their physical footprints. Same-store sales is an industry measure of whether revenue is growing at those existing stores and is driven by customer visits (often called traffic) and the average spending per customer (ticket).
Arhaus’s demand has been shrinking over the last two years as its same-store sales have averaged 3.2% annual declines. This performance is concerning - it shows Arhaus artificially boosts its revenue by building new stores. We’d like to see a company’s same-store sales rise before it takes on the costly, capital-intensive endeavor of expanding its store base.
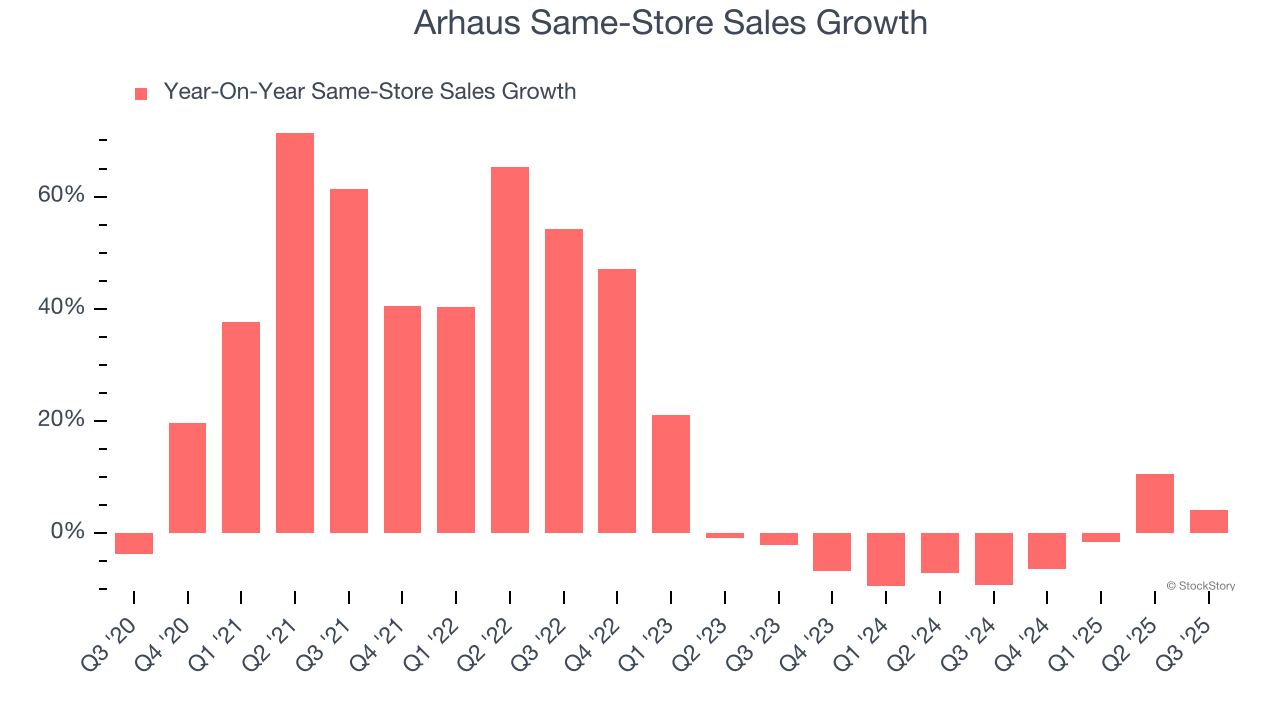
In the latest quarter, Arhaus’s same-store sales rose 4.1% year on year. This growth was a well-appreciated turnaround from its historical levels, showing the business is regaining momentum.
Key Takeaways from Arhaus’s Q3 Results
We enjoyed seeing Arhaus beat analysts’ EBITDA expectations this quarter. We were also glad its revenue outperformed Wall Street’s estimates. On the other hand, its EBITDA guidance for next quarter missed. Overall, this print had some key positives. The stock traded up 1.7% to $9.90 immediately following the results.
Is Arhaus an attractive investment opportunity at the current price? We think that the latest quarter is only one piece of the longer-term business quality puzzle. Quality, when combined with valuation, can help determine if the stock is a buy. We cover that in our actionable full research report which you can read here, it’s free for active Edge members.