
Financial guaranty insurer Assured Guaranty (NYSE: AGO) reported Q3 CY2025 results exceeding the market’s revenue expectations, but sales fell by 23% year on year to $207 million. Its non-GAAP profit of $2.57 per share was 67.2% above analysts’ consensus estimates.
Is now the time to buy Assured Guaranty? Find out by accessing our full research report, it’s free for active Edge members.
Assured Guaranty (AGO) Q3 CY2025 Highlights:
HAMILTON, Bermuda--(BUSINESS WIRE)--Assured Guaranty Ltd. (NYSE: AGO) (AGL and, together with its subsidiaries, Assured Guaranty or the Company) announced today its financial results for the three-month period ended June 30, 2025 (second quarter 2025). “Assured Guaranty’s shareholder value increased again in the first half of 2025,” said Dominic Frederico, President and CEO.
Company Overview
Serving as a financial safety net for over $11 trillion in debt service payments since its founding in 2003, Assured Guaranty (NYSE: AGO) provides credit protection products that guarantee scheduled payments on municipal bonds, infrastructure projects, and structured finance obligations.
Revenue Growth
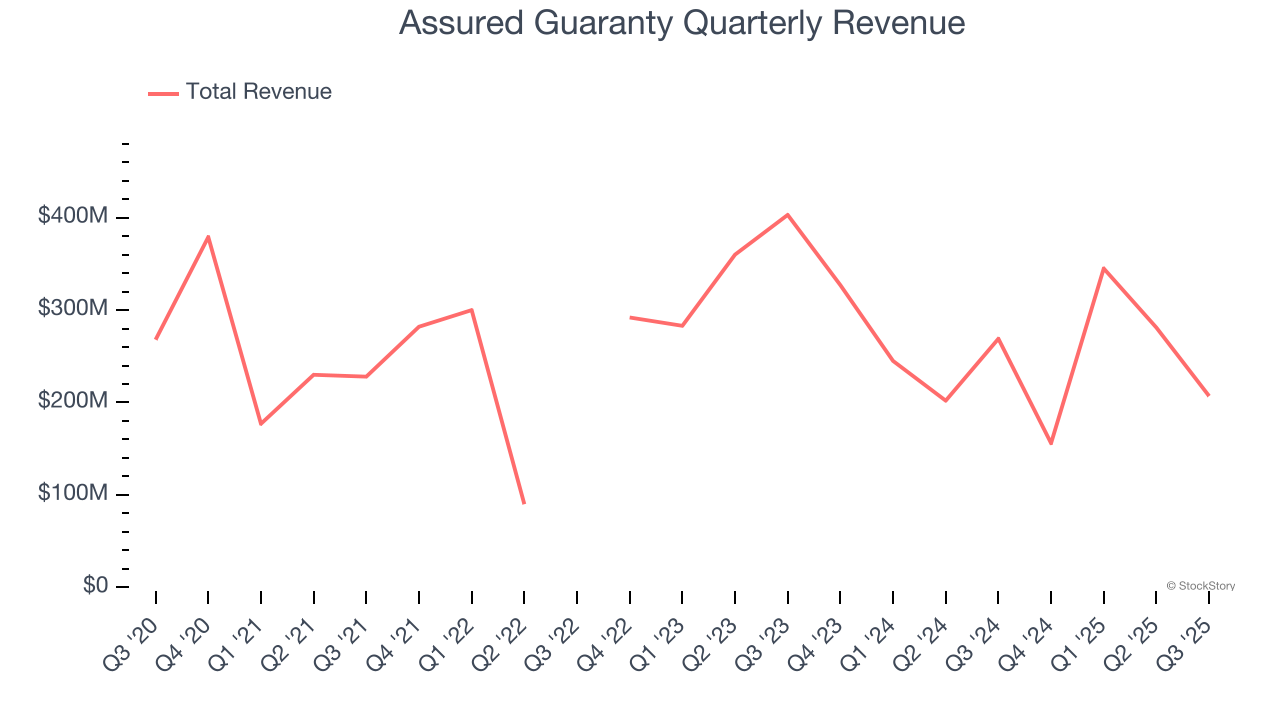
Big picture, insurers generate revenue from three key sources. The first is the core business of underwriting policies. The second source is income from investing the “float” (premiums collected upfront not yet paid out as claims) in assets such as fixed-income assets and equities. The third is fees from various sources such as policy administration, annuities, or other value-added services. Unfortunately, Assured Guaranty struggled to consistently increase demand as its $989 million of revenue for the trailing 12 months was close to its revenue five years ago. This wasn’t a great result and suggests it’s a low quality business.
 Note: Quarters not shown were determined to be outliers, impacted by outsized investment gains/losses that are not indicative of the recurring fundamentals of the business.
Long-term growth is the most important, but within financials, a half-decade historical view may miss recent interest rate changes and market returns. Assured Guaranty’s recent performance shows its demand remained suppressed as its revenue has declined by 14% annually over the last two years. 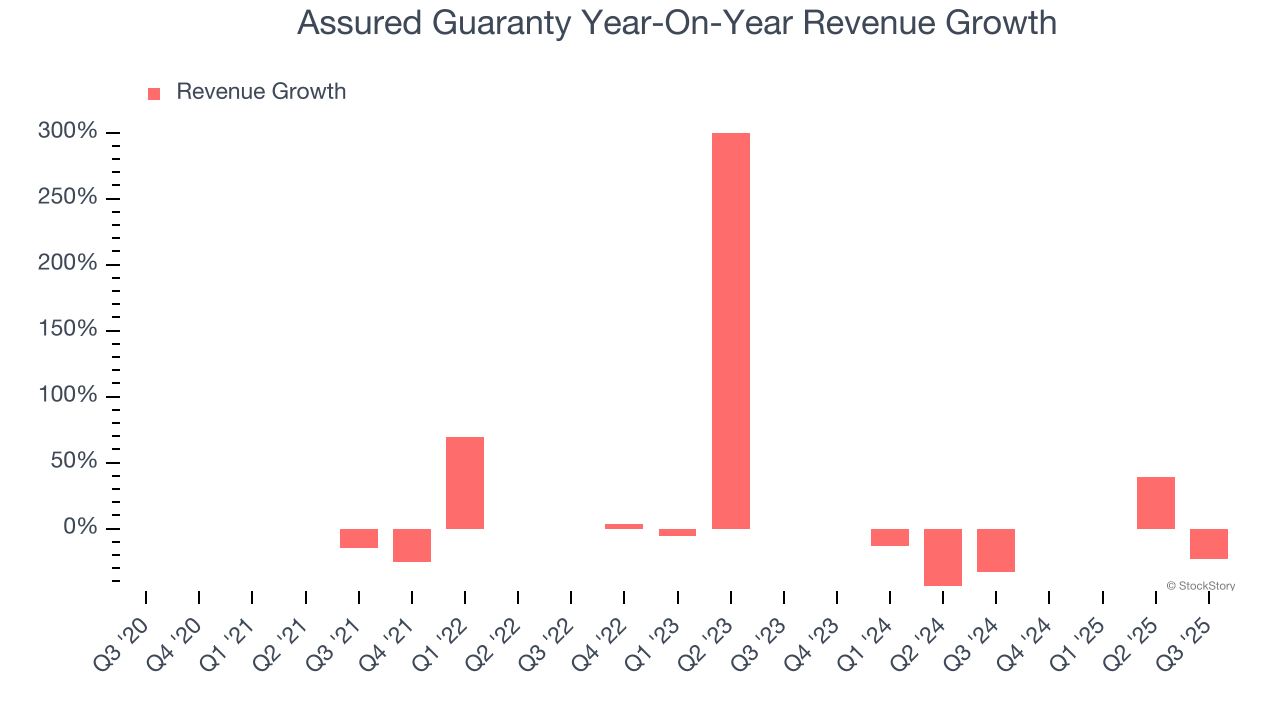 Note: Quarters not shown were determined to be outliers, impacted by outsized investment gains/losses that are not indicative of the recurring fundamentals of the business.
This quarter, Assured Guaranty’s revenue fell by 23% year on year to $207 million but beat Wall Street’s estimates by 12.2%.
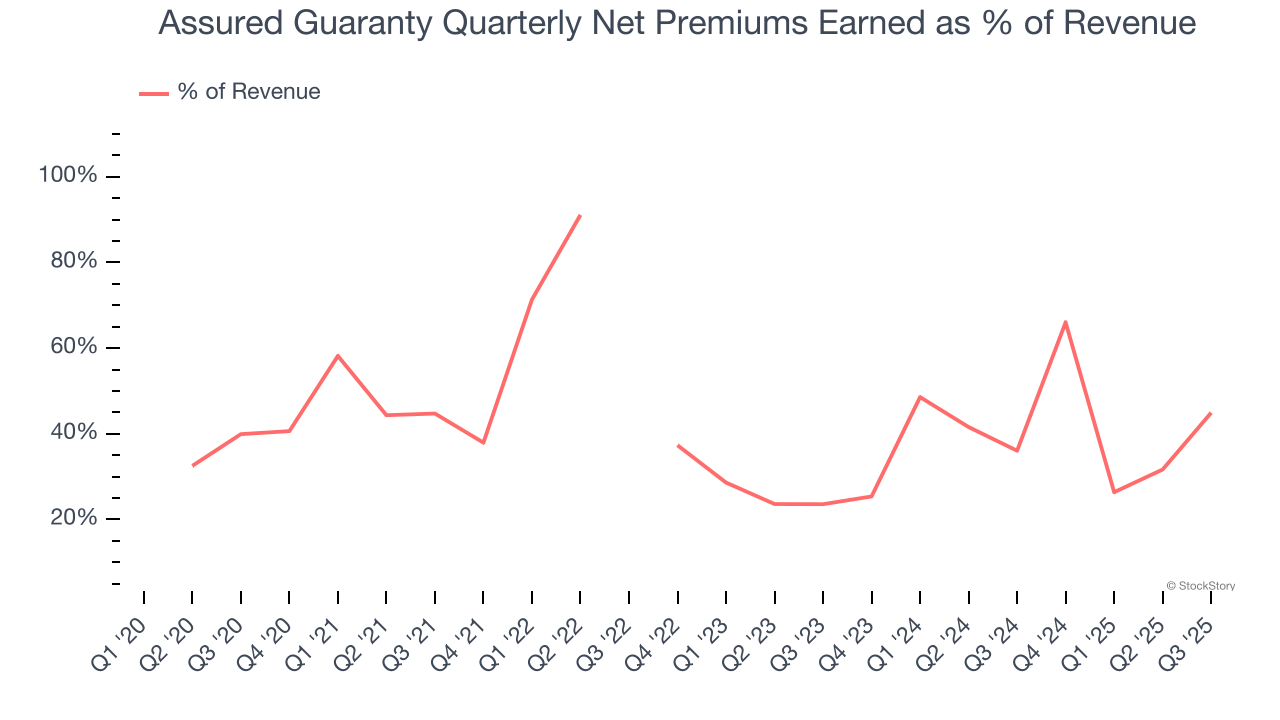
Net premiums earned made up 40.8% of the company’s total revenue during the last five years, meaning Assured Guaranty’s growth drivers strike a balance between insurance and non-insurance activities.
 Note: Quarters not shown were determined to be outliers, impacted by outsized investment gains/losses that are not indicative of the recurring fundamentals of the business.
Our experience and research show the market cares primarily about an insurer’s net premiums earned growth as investment and fee income are considered more susceptible to market volatility and economic cycles.
Microsoft, Alphabet, Coca-Cola, Monster Beverage—all began as under-the-radar growth stories riding a massive trend. We’ve identified the next one: a profitable AI semiconductor play Wall Street is still overlooking. Go here for access to our full report.
Book Value Per Share (BVPS)
Insurers are balance sheet businesses, collecting premiums upfront and paying out claims over time. Premiums collected but not yet paid out, often referred to as the float, are invested and create an asset base supported by a liability structure. Book value per share (BVPS) captures this dynamic by measuring these assets (investment portfolio, cash, reinsurance recoverables) less liabilities (claim reserves, debt, future policy benefits). BVPS is essentially the residual value for shareholders.
We therefore consider BVPS very important to track for insurers and a metric that sheds light on business quality because it reflects long-term capital growth and is harder to manipulate than more commonly-used metrics like EPS.
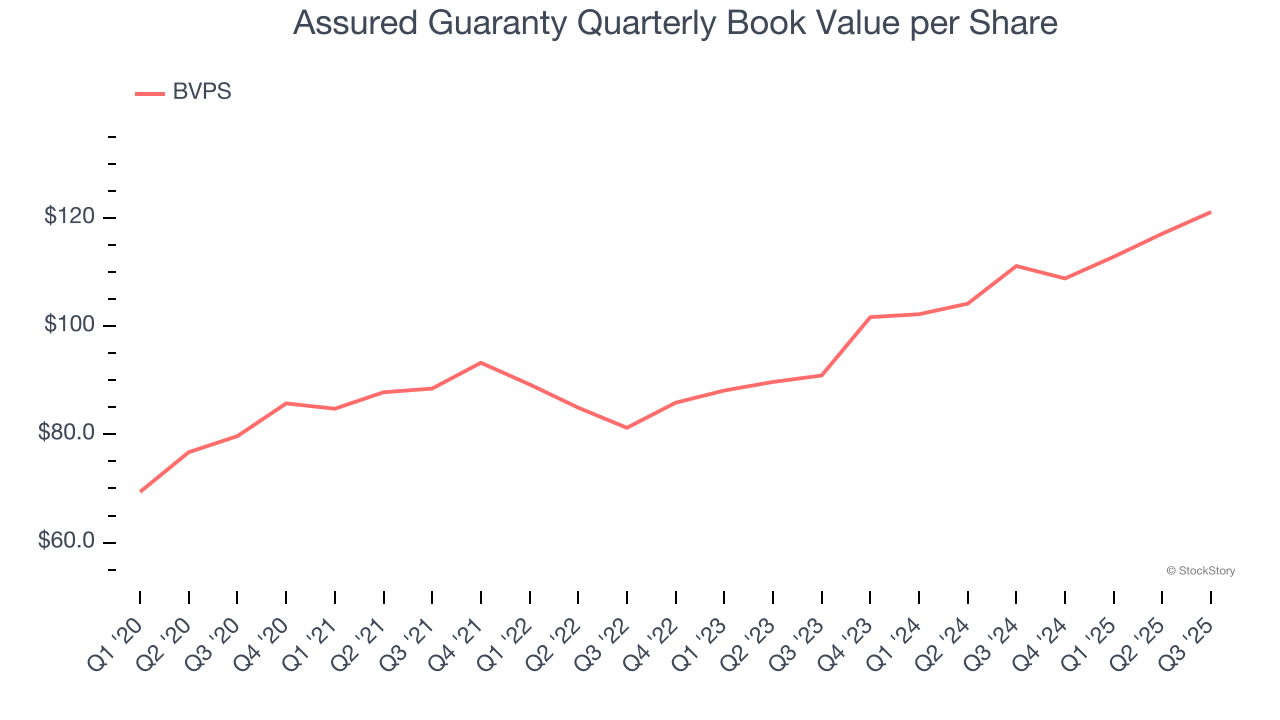
Assured Guaranty’s BVPS grew at a decent 8.7% annual clip over the last five years. BVPS growth has accelerated recently, growing by 15.4% annually over the last two years from $90.89 to $121.13 per share.
Key Takeaways from Assured Guaranty’s Q3 Results
It was good to see Assured Guaranty beat analysts’ EPS expectations this quarter. We were also excited its revenue outperformed Wall Street’s estimates by a wide margin. Zooming out, we think this was a solid print. The stock remained flat at $80.75 immediately after reporting.
Should you buy the stock or not? When making that decision, it’s important to consider its valuation, business qualities, as well as what has happened in the latest quarter. We cover that in our actionable full research report which you can read here, it’s free for active Edge members.


