
Healthcare services company Astrana Health reported Q3 CY2025 results beating Wall Street’s revenue expectations, with sales up 99.7% year on year to $956 million. On the other hand, the company’s full-year revenue guidance of $3.14 billion at the midpoint came in 2.2% below analysts’ estimates. Its GAAP profit of $0.01 per share was 97.6% below analysts’ consensus estimates.
Is now the time to buy Astrana Health? Find out by accessing our full research report, it’s free for active Edge members.
Astrana Health (ASTH) Q3 CY2025 Highlights:
- Closes Prospect Health acquisition
- Revenue: $956 million vs analyst estimates of $950.2 million (99.7% year-on-year growth, 0.6% beat)
- EPS (GAAP): $0.01 vs analyst expectations of $0.43 (97.6% miss)
- Adjusted EBITDA: $68.48 million vs analyst estimates of $67.29 million (7.2% margin, 1.8% beat)
- The company dropped its revenue guidance for the full year to $3.14 billion at the midpoint from $3.2 billion, a 1.9% decrease
- EBITDA guidance for the full year is $205 million at the midpoint, below analyst estimates of $220 million
- Operating Margin: 2%, down from 5.9% in the same quarter last year
- Free Cash Flow Margin: 0.8%, down from 6.6% in the same quarter last year
- Market Capitalization: $1.66 billion
"Astrana delivered solid third quarter results and demonstrated strong momentum in our first quarter of combined operations with Prospect Health," said Brandon Sim, President and Chief Executive Officer.
Company Overview
Formerly known as Apollo Medical Holdings until early 2024, Astrana Health (NASDAQ: ASTH) operates a technology-powered healthcare platform that enables physicians to deliver coordinated care while successfully participating in value-based payment models.
Revenue Growth
A company’s long-term sales performance can indicate its overall quality. Even a bad business can shine for one or two quarters, but a top-tier one grows for years. Luckily, Astrana Health’s sales grew at an incredible 33.3% compounded annual growth rate over the last five years. Its growth beat the average healthcare company and shows its offerings resonate with customers, a helpful starting point for our analysis.
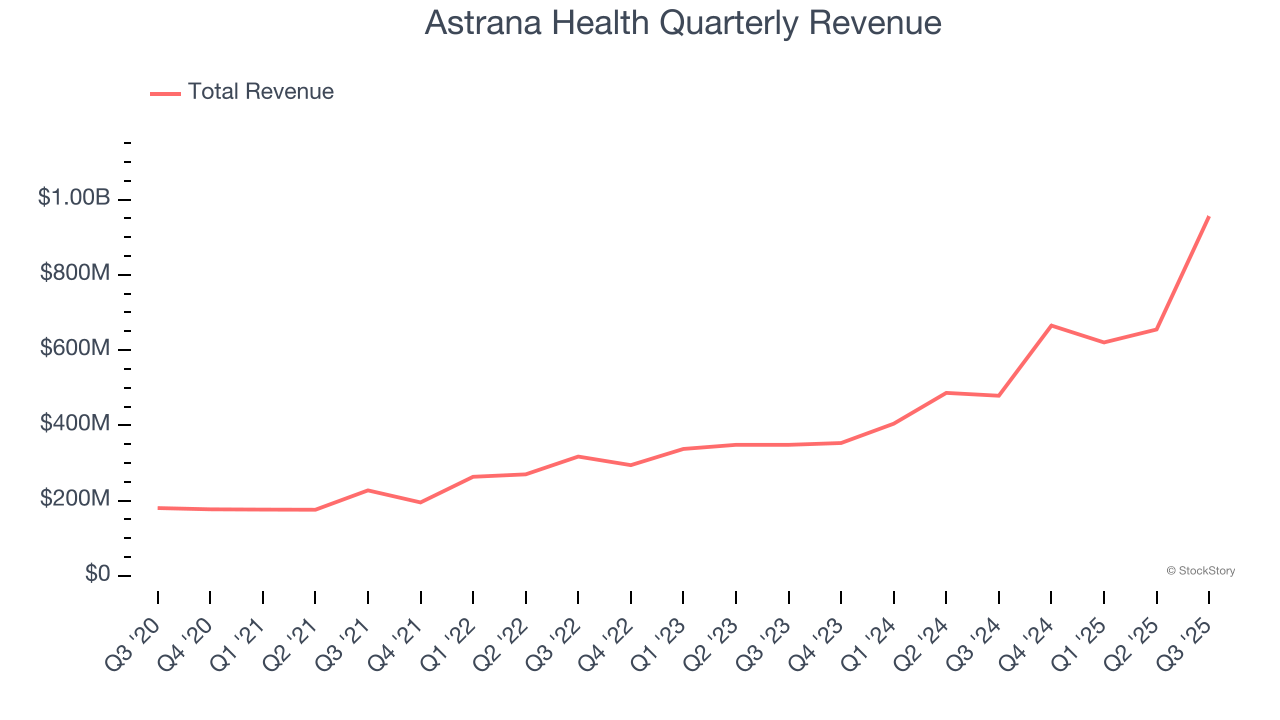
Long-term growth is the most important, but within healthcare, a half-decade historical view may miss new innovations or demand cycles. Astrana Health’s annualized revenue growth of 47.7% over the last two years is above its five-year trend, suggesting its demand was strong and recently accelerated. 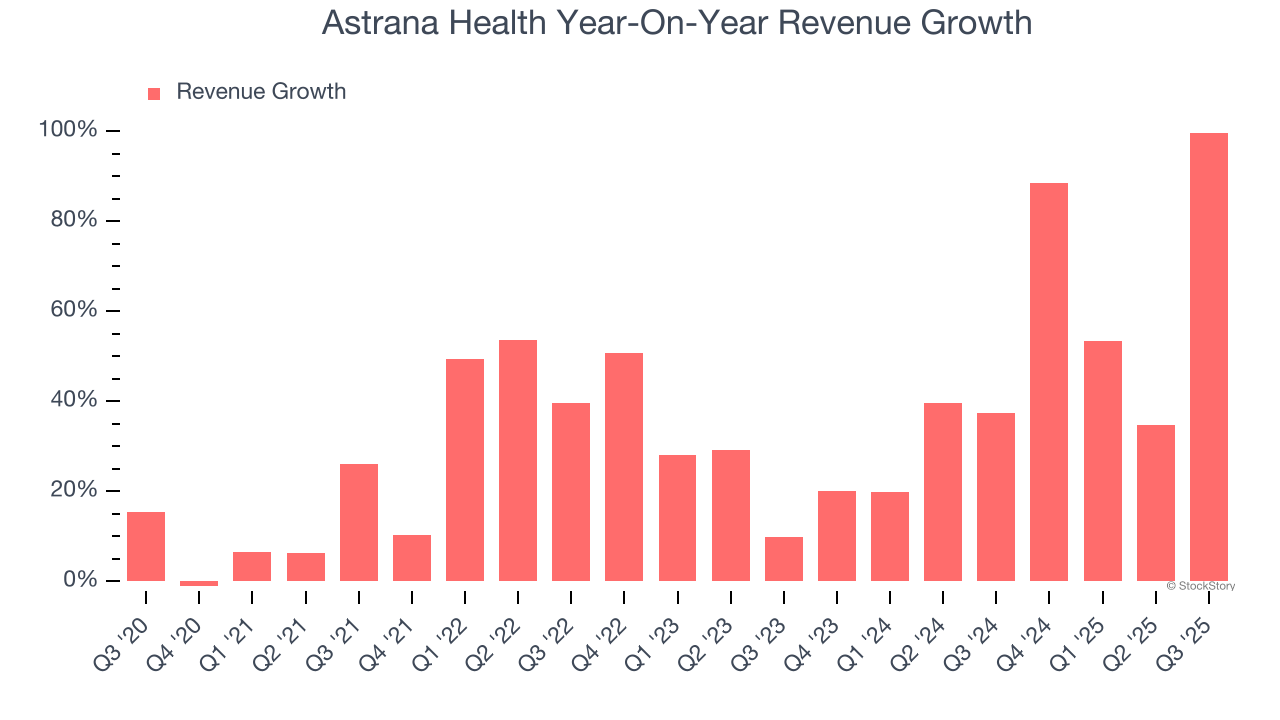
This quarter, Astrana Health reported magnificent year-on-year revenue growth of 99.7%, and its $956 million of revenue beat Wall Street’s estimates by 0.6%.
Looking ahead, sell-side analysts expect revenue to grow 37.2% over the next 12 months, a deceleration versus the last two years. Despite the slowdown, this projection is commendable and implies the market is baking in success for its products and services.
Software is eating the world and there is virtually no industry left that has been untouched by it. That drives increasing demand for tools helping software developers do their jobs, whether it be monitoring critical cloud infrastructure, integrating audio and video functionality, or ensuring smooth content streaming. Click here to access a free report on our 3 favorite stocks to play this generational megatrend.
Operating Margin
Operating margin is one of the best measures of profitability because it tells us how much money a company takes home after subtracting all core expenses, like marketing and R&D.
Astrana Health was profitable over the last five years but held back by its large cost base. Its average operating margin of 6% was weak for a healthcare business.
Analyzing the trend in its profitability, Astrana Health’s operating margin decreased by 14 percentage points over the last five years. The company’s two-year trajectory also shows it failed to get its profitability back to the peak as its margin fell by 5.5 percentage points. This performance was poor no matter how you look at it - it shows its expenses were rising and it couldn’t pass those costs onto its customers.
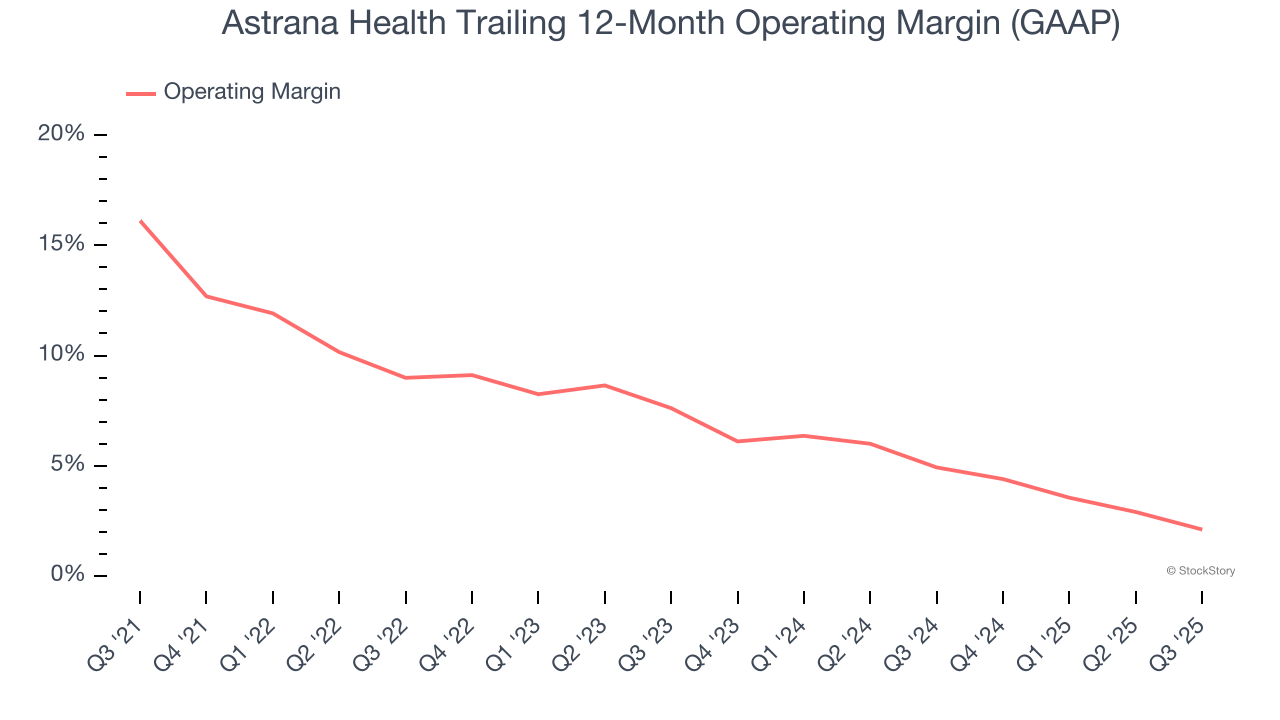
In Q3, Astrana Health generated an operating margin profit margin of 2%, down 3.9 percentage points year on year. This contraction shows it was less efficient because its expenses grew faster than its revenue.
Earnings Per Share
We track the long-term change in earnings per share (EPS) for the same reason as long-term revenue growth. Compared to revenue, however, EPS highlights whether a company’s growth is profitable.
Sadly for Astrana Health, its EPS declined by 27.1% annually over the last five years while its revenue grew by 33.3%. This tells us the company became less profitable on a per-share basis as it expanded.
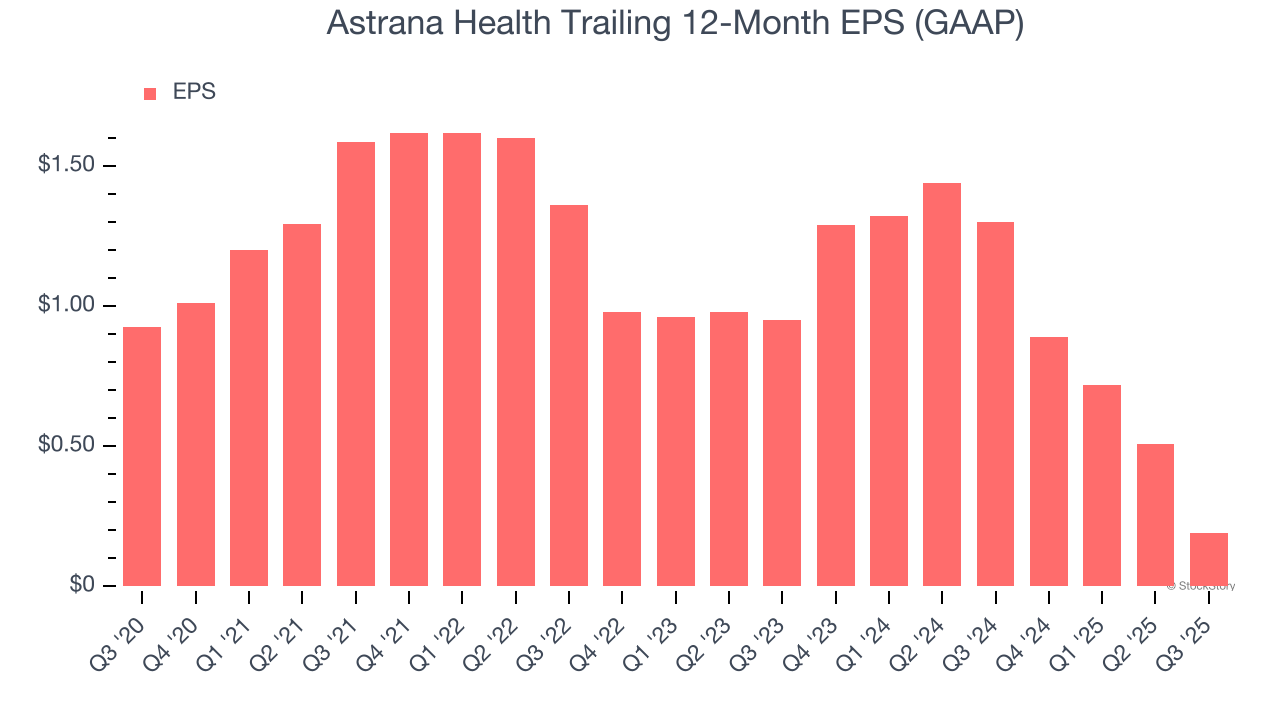
Diving into the nuances of Astrana Health’s earnings can give us a better understanding of its performance. As we mentioned earlier, Astrana Health’s operating margin declined by 14 percentage points over the last five years. Its share count also grew by 187%, meaning the company not only became less efficient with its operating expenses but also diluted its shareholders. 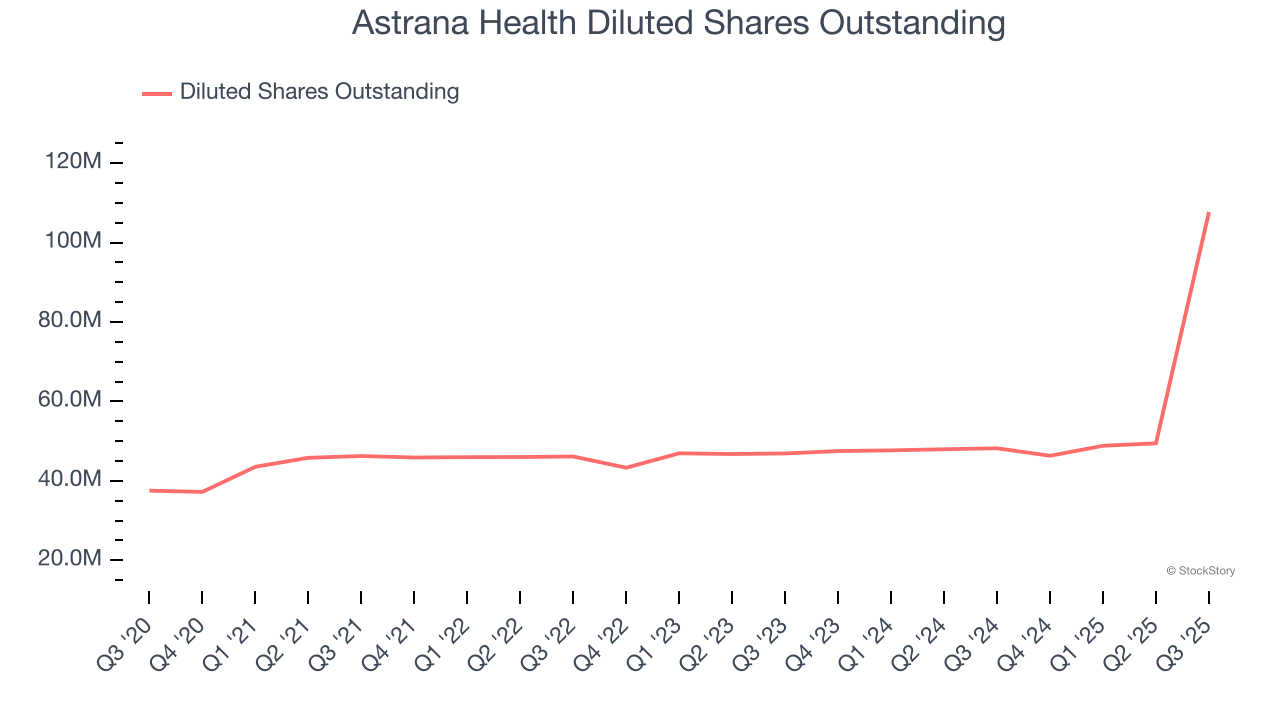
In Q3, Astrana Health reported EPS of $0.01, down from $0.33 in the same quarter last year. This print missed analysts’ estimates. Over the next 12 months, Wall Street expects Astrana Health’s full-year EPS of $0.19 to grow 877%.
Key Takeaways from Astrana Health’s Q3 Results
It was good to see Astrana Health narrowly top analysts’ revenue expectations this quarter. On the other hand, its EPS missed and its full-year revenue guidance fell short of Wall Street’s estimates. Overall, this quarter could have been better. The stock traded down 1.5% to $32.88 immediately following the results.
Astrana Health’s latest earnings report disappointed. One quarter doesn’t define a company’s quality, so let’s explore whether the stock is a buy at the current price. We think that the latest quarter is only one piece of the longer-term business quality puzzle. Quality, when combined with valuation, can help determine if the stock is a buy. We cover that in our actionable full research report which you can read here, it’s free for active Edge members.