
Senior living provider Brookdale Senior Living (NYSE: BKD) fell short of the markets revenue expectations in Q3 CY2025 as sales rose 3.7% year on year to $813.2 million. Its GAAP loss of $0.48 per share was significantly below analysts’ consensus estimates.
Is now the time to buy Brookdale? Find out by accessing our full research report, it’s free for active Edge members.
Brookdale (BKD) Q3 CY2025 Highlights:
- Revenue: $813.2 million vs analyst estimates of $827.4 million (3.7% year-on-year growth, 1.7% miss)
- EPS (GAAP): -$0.48 vs analyst estimates of -$0.17 (significant miss)
- Adjusted EBITDA: $111.1 million vs analyst estimates of $106.1 million (13.7% margin, 4.7% beat)
- EBITDA guidance for the full year is $457.5 million at the midpoint, above analyst estimates of $453 million
- Operating Margin: -6.6%, down from 1.4% in the same quarter last year
- Free Cash Flow Margin: 14.1%, up from 1.5% in the same quarter last year
- Market Capitalization: $2.20 billion
"Brookdale's solid third quarter results highlight the underlying strength of our company amidst the accelerating tailwind from increasing demand for senior living coupled with suppressed inventory growth," said Nick Stengle, Brookdale's Chief Executive Officer.
Company Overview
With a network of over 650 communities serving approximately 59,000 residents across 41 states, Brookdale Senior Living (NYSE: BKD) operates senior living communities across the United States, offering independent living, assisted living, memory care, and continuing care retirement communities.
Revenue Growth
A company’s long-term sales performance is one signal of its overall quality. Any business can have short-term success, but a top-tier one grows for years. Brookdale’s demand was weak over the last five years as its sales fell at a 2.6% annual rate. This was below our standards and is a sign of poor business quality.
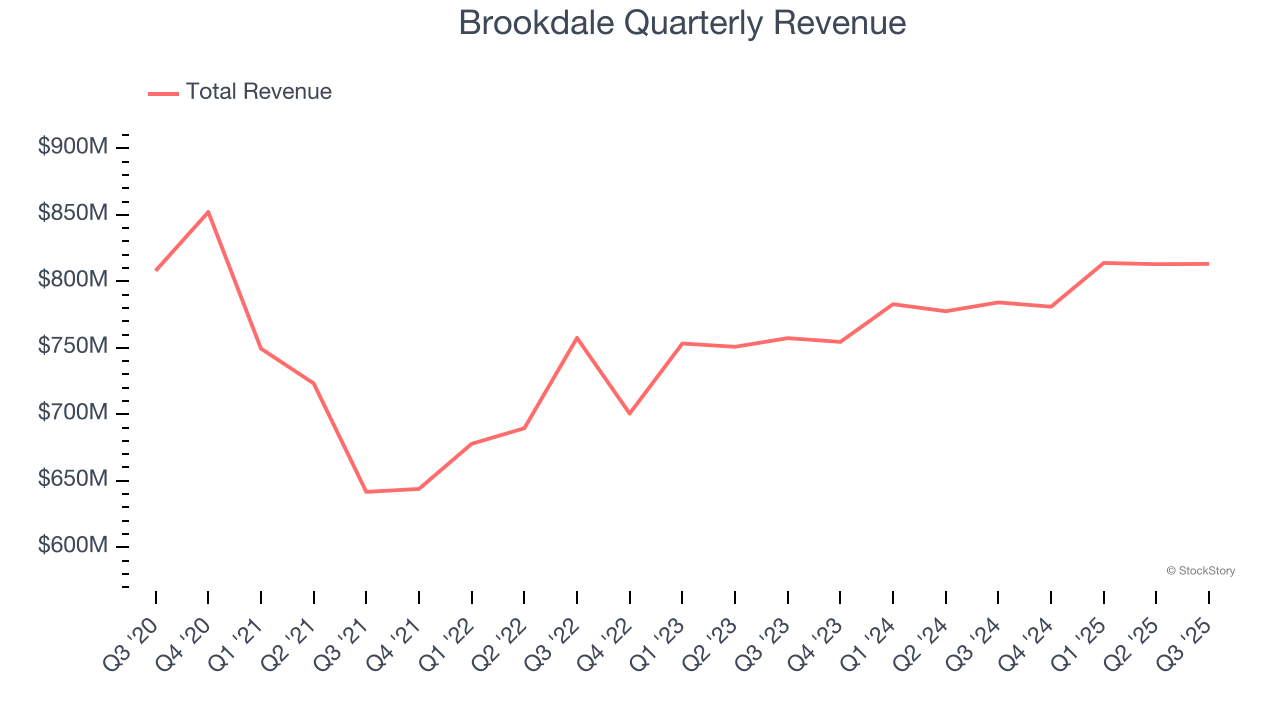
We at StockStory place the most emphasis on long-term growth, but within healthcare, a half-decade historical view may miss recent innovations or disruptive industry trends. Brookdale’s annualized revenue growth of 4.3% over the last two years is above its five-year trend, but we were still disappointed by the results. 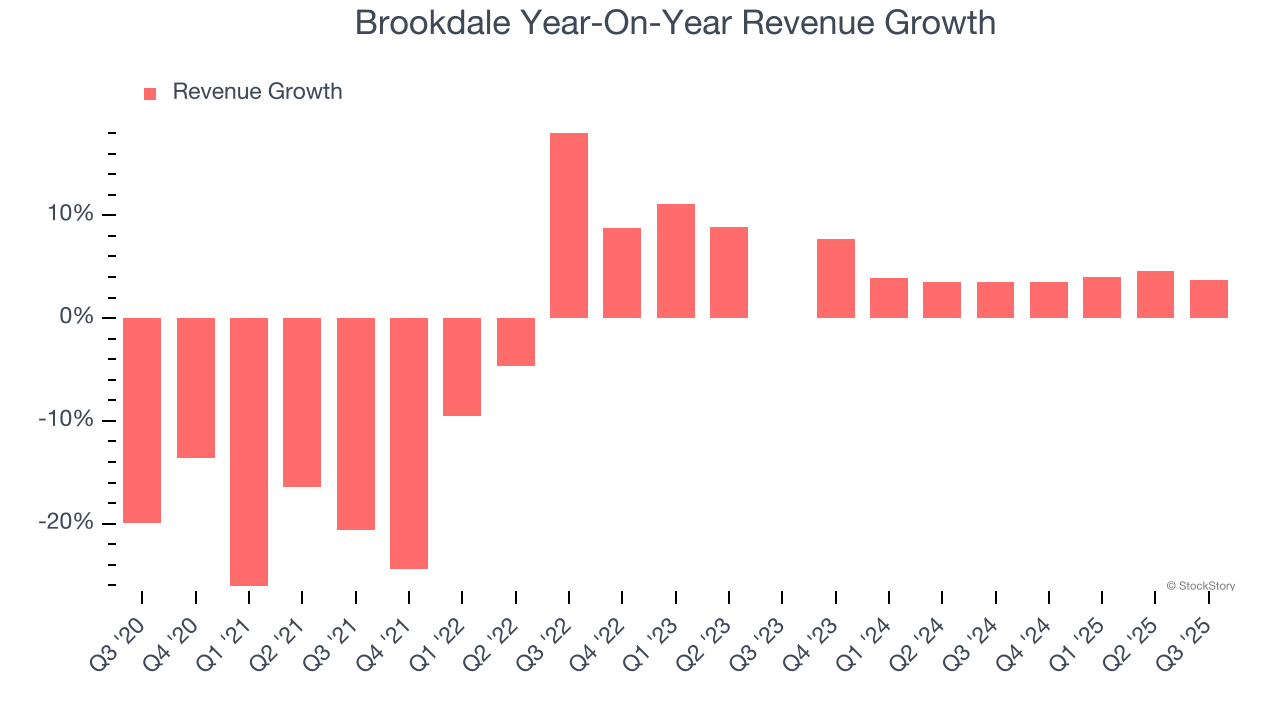
This quarter, Brookdale’s revenue grew by 3.7% year on year to $813.2 million, falling short of Wall Street’s estimates.
Looking ahead, sell-side analysts expect revenue to decline by 3.4% over the next 12 months, a deceleration versus the last two years. This projection is underwhelming and suggests its products and services will see some demand headwinds.
Software is eating the world and there is virtually no industry left that has been untouched by it. That drives increasing demand for tools helping software developers do their jobs, whether it be monitoring critical cloud infrastructure, integrating audio and video functionality, or ensuring smooth content streaming. Click here to access a free report on our 3 favorite stocks to play this generational megatrend.
Operating Margin
Brookdale was roughly breakeven when averaging the last five years of quarterly operating profits, lousy for a healthcare business.
On the plus side, Brookdale’s operating margin rose by 4.5 percentage points over the last five years. Zooming into its more recent performance, however, we can see the company’s margin has decreased by 3.1 percentage points on a two-year basis. If Brookdale wants to pass our bar, it must prove it can expand its profitability consistently.
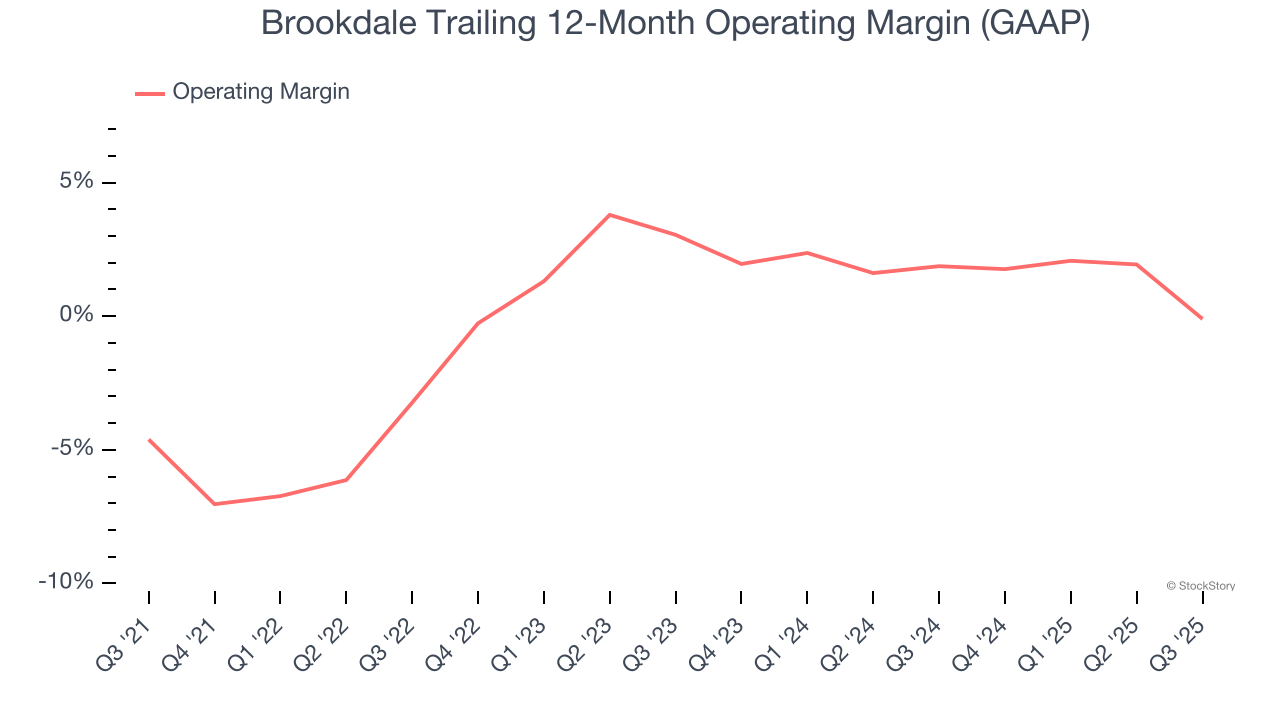
This quarter, Brookdale generated a negative 6.6% operating margin. The company's consistent lack of profits raise a flag.
Earnings Per Share
We track the long-term change in earnings per share (EPS) for the same reason as long-term revenue growth. Compared to revenue, however, EPS highlights whether a company’s growth is profitable.
Sadly for Brookdale, its EPS declined by 56.1% annually over the last five years, more than its revenue. However, its operating margin actually improved during this time, telling us that non-fundamental factors such as interest expenses and taxes affected its ultimate earnings.
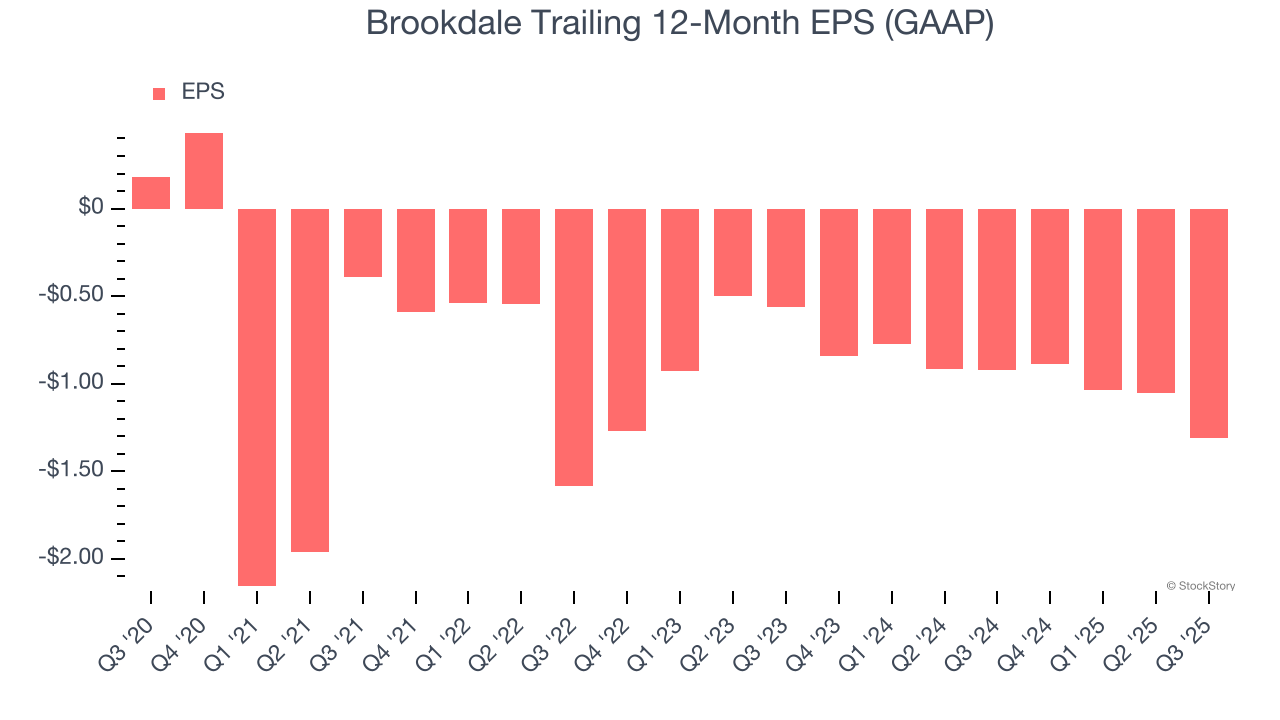
Diving into the nuances of Brookdale’s earnings can give us a better understanding of its performance. A five-year view shows Brookdale has diluted its shareholders, growing its share count by 29.6%. This dilution overshadowed its increased operational efficiency and has led to lower per share earnings. Taxes and interest expenses can also affect EPS but don’t tell us as much about a company’s fundamentals. 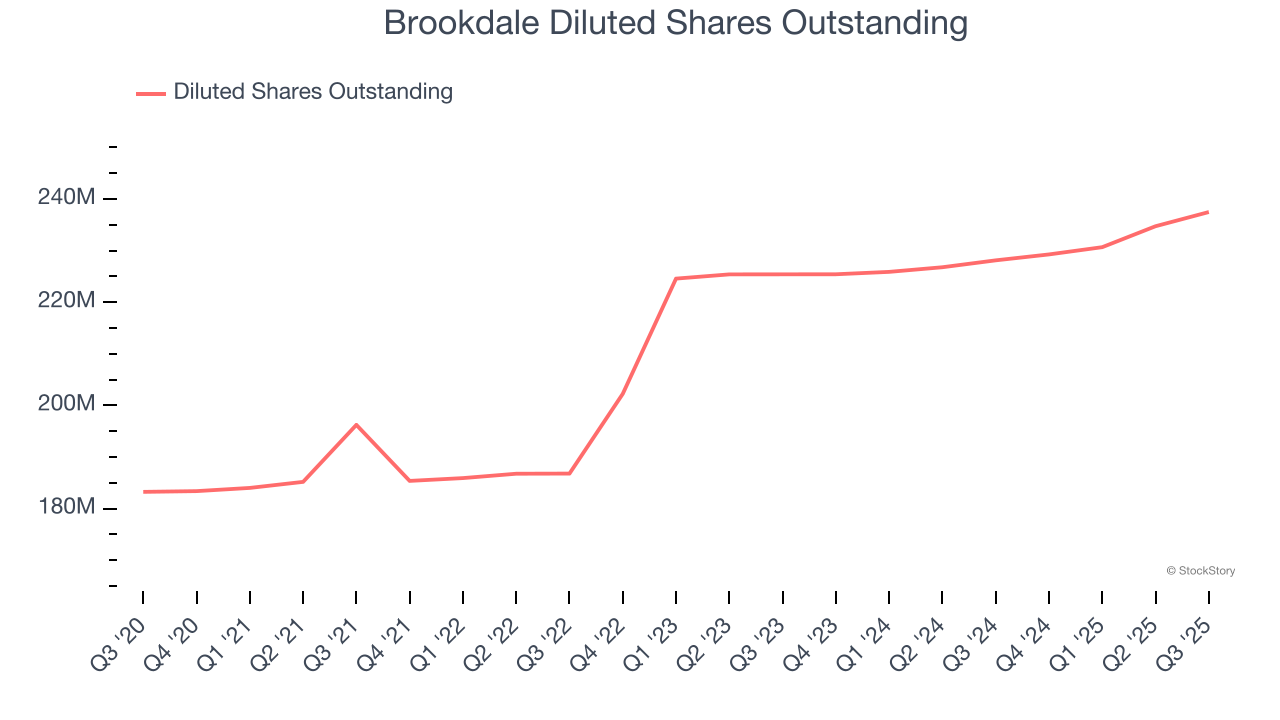
In Q3, Brookdale reported EPS of negative $0.48, down from negative $0.22 in the same quarter last year. This print missed analysts’ estimates. Over the next 12 months, Wall Street expects Brookdale to improve its earnings losses. Analysts forecast its full-year EPS of negative $1.31 will advance to negative $0.45.
Key Takeaways from Brookdale’s Q3 Results
We struggled to find many positives in these results. Its EPS missed and its revenue fell short of Wall Street’s estimates. Overall, this quarter could have been better. The stock remained flat at $9.06 immediately following the results.
The latest quarter from Brookdale’s wasn’t that good. One earnings report doesn’t define a company’s quality, though, so let’s explore whether the stock is a buy at the current price. We think that the latest quarter is only one piece of the longer-term business quality puzzle. Quality, when combined with valuation, can help determine if the stock is a buy. We cover that in our actionable full research report which you can read here, it’s free for active Edge members.


