
Digital engineering services company EPAM Systems (NYSE: EPAM) beat Wall Street’s revenue expectations in Q3 CY2025, with sales up 19.4% year on year to $1.39 billion. Guidance for next quarter’s revenue was better than expected at $1.39 billion at the midpoint, 0.8% above analysts’ estimates. Its non-GAAP profit of $3.08 per share was 1.7% above analysts’ consensus estimates.
Is now the time to buy EPAM? Find out by accessing our full research report, it’s free for active Edge members.
EPAM (EPAM) Q3 CY2025 Highlights:
- Revenue: $1.39 billion vs analyst estimates of $1.37 billion (19.4% year-on-year growth, 1.4% beat)
- Adjusted EPS: $3.08 vs analyst estimates of $3.03 (1.7% beat)
- Adjusted EBITDA: $179.5 million vs analyst estimates of $233.8 million (12.9% margin, 23.3% miss)
- Revenue Guidance for Q4 CY2025 is $1.39 billion at the midpoint, roughly in line with what analysts were expecting
- Management raised its full-year Adjusted EPS guidance to $11.40 at the midpoint, a 3.3% increase
- Operating Margin: 10.4%, down from 15.2% in the same quarter last year
- Constant Currency Revenue rose 7.1% year on year (0.9% in the same quarter last year)
- Market Capitalization: $8.96 billion
"We are pleased to deliver another quarter of improving year-over-year organic constant currency revenue growth, driven by our deep engineering expertise and focus on helping clients build out their AI foundation and transform themselves into AI-Native organizations," said Balazs Fejes, CEO and President at EPAM.
Company Overview
Founded in 1993 during the early days of offshore software development, EPAM Systems (NYSE: EPAM) provides digital engineering, cloud, and AI transformation services to help global enterprises and startups modernize their technology systems and create digital products.
Revenue Growth
Reviewing a company’s long-term sales performance reveals insights into its quality. Any business can have short-term success, but a top-tier one grows for years.
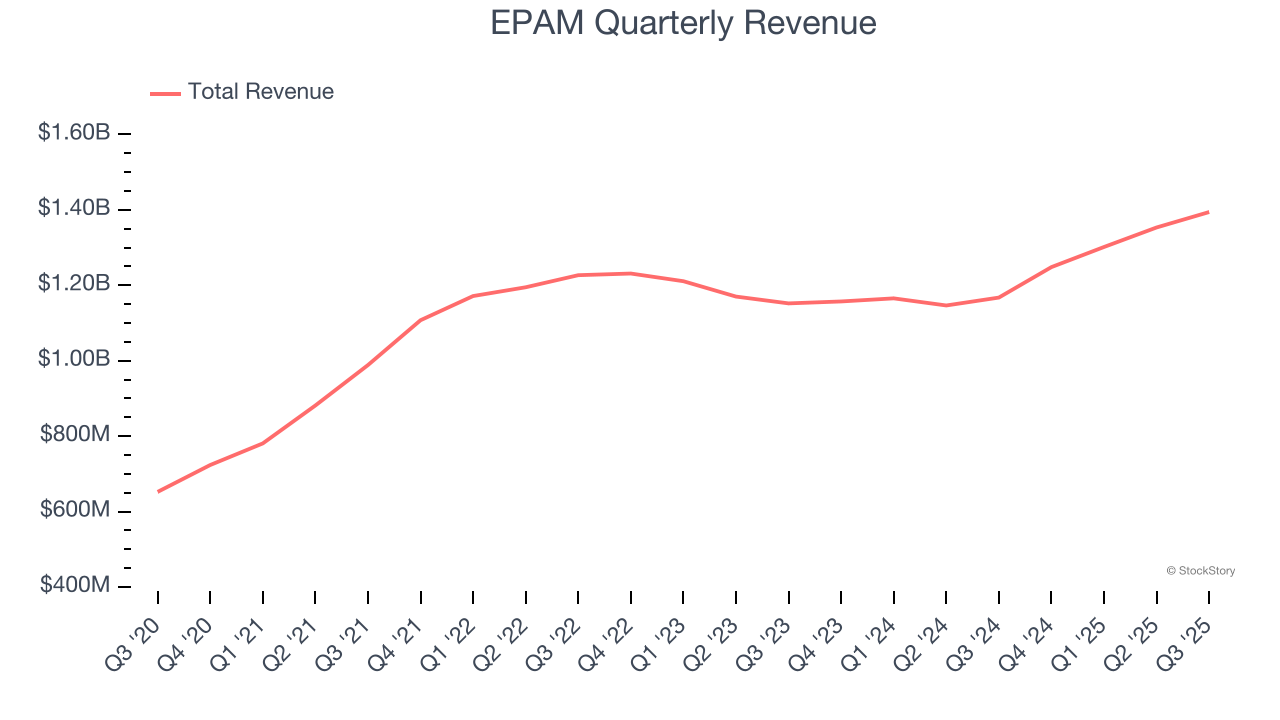
With $5.30 billion in revenue over the past 12 months, EPAM is one of the larger companies in the business services industry and benefits from a well-known brand that influences purchasing decisions.
As you can see below, EPAM grew its sales at an incredible 15.6% compounded annual growth rate over the last five years. This shows it had high demand, a useful starting point for our analysis.
We at StockStory place the most emphasis on long-term growth, but within business services, a half-decade historical view may miss recent innovations or disruptive industry trends. EPAM’s annualized revenue growth of 5.4% over the last two years is below its five-year trend, but we still think the results were respectable. 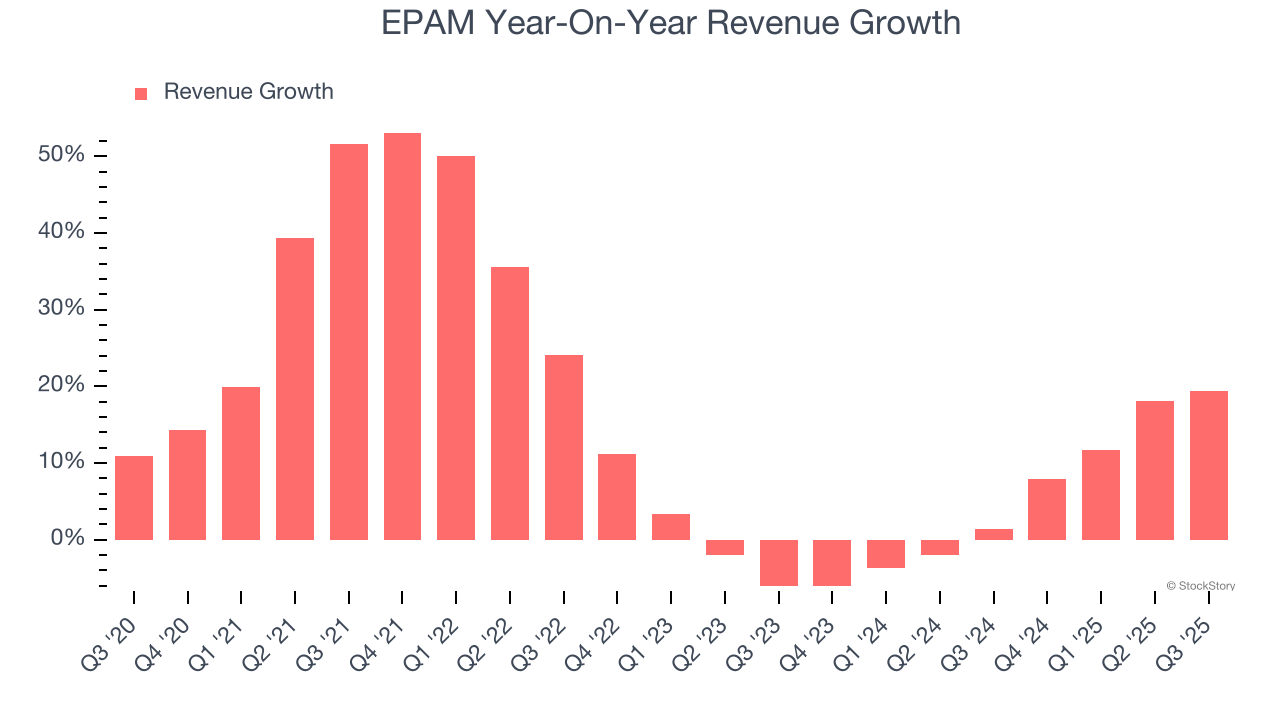
EPAM also reports sales performance excluding currency movements, which are outside the company’s control and not indicative of demand. Over the last two years, its constant currency sales averaged 4% year-on-year growth. Because this number aligns with its normal revenue growth, we can see that EPAM has properly hedged its foreign currency exposure. 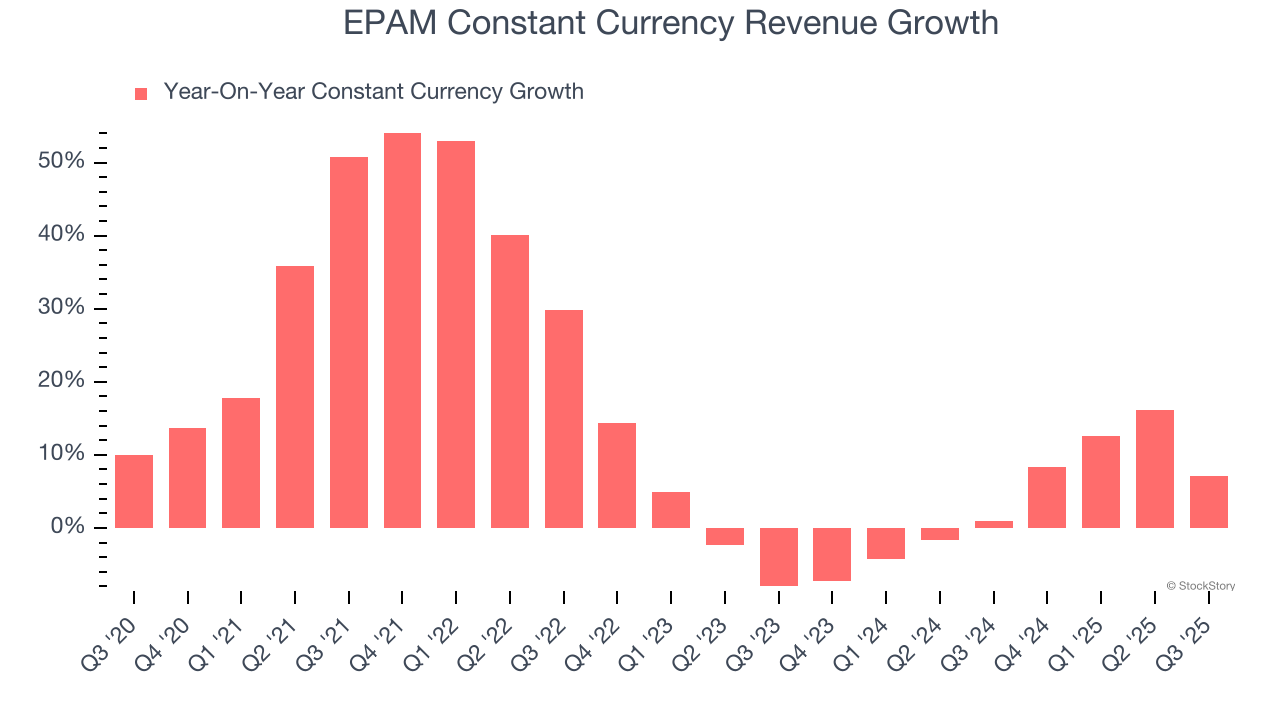
This quarter, EPAM reported year-on-year revenue growth of 19.4%, and its $1.39 billion of revenue exceeded Wall Street’s estimates by 1.4%. Company management is currently guiding for a 11.1% year-on-year increase in sales next quarter.
Looking further ahead, sell-side analysts expect revenue to grow 7.2% over the next 12 months, an improvement versus the last two years. This projection is noteworthy and indicates its newer products and services will fuel better top-line performance.
Microsoft, Alphabet, Coca-Cola, Monster Beverage—all began as under-the-radar growth stories riding a massive trend. We’ve identified the next one: a profitable AI semiconductor play Wall Street is still overlooking. Go here for access to our full report.
Operating Margin
EPAM has done a decent job managing its cost base over the last five years. The company has produced an average operating margin of 11.6%, higher than the broader business services sector.
Looking at the trend in its profitability, EPAM’s operating margin decreased by 4.9 percentage points over the last five years. This raises questions about the company’s expense base because its revenue growth should have given it leverage on its fixed costs, resulting in better economies of scale and profitability.
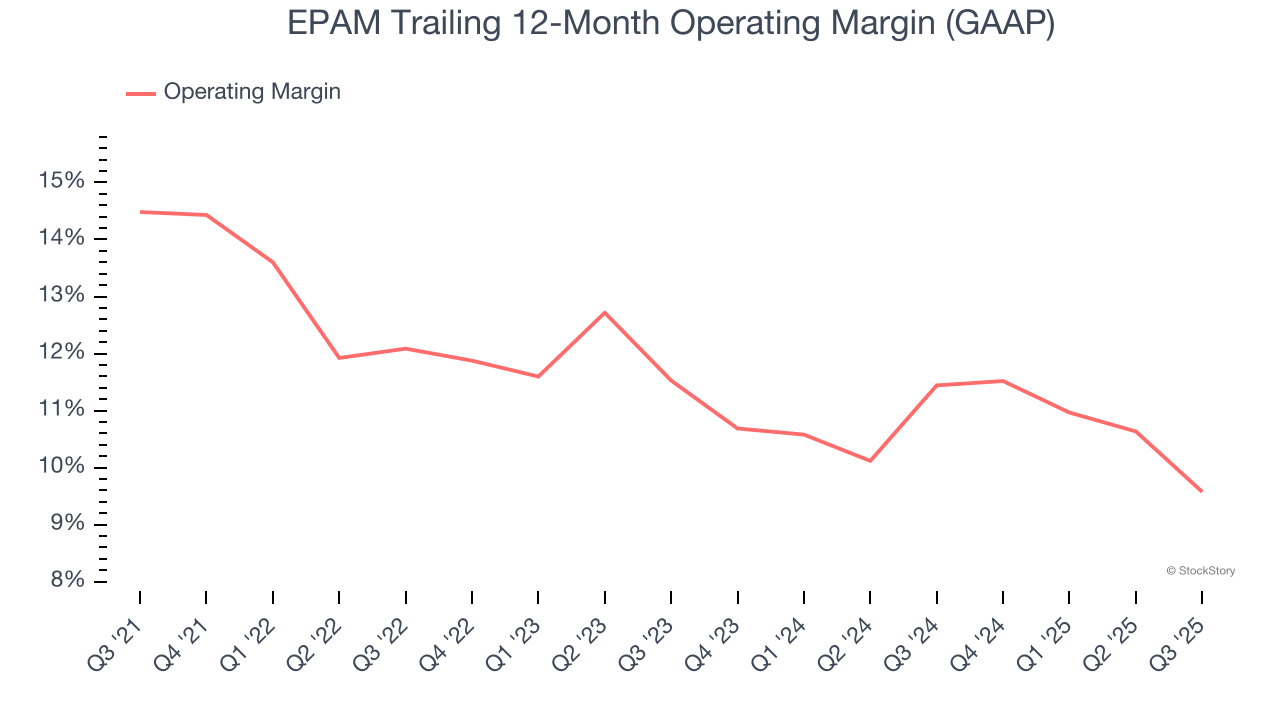
This quarter, EPAM generated an operating margin profit margin of 10.4%, down 4.8 percentage points year on year. This contraction shows it was less efficient because its expenses grew faster than its revenue.
Earnings Per Share
Revenue trends explain a company’s historical growth, but the long-term change in earnings per share (EPS) points to the profitability of that growth – for example, a company could inflate its sales through excessive spending on advertising and promotions.
EPAM’s EPS grew at a spectacular 12.9% compounded annual growth rate over the last five years. However, this performance was lower than its 15.6% annualized revenue growth, telling us the company became less profitable on a per-share basis as it expanded due to non-fundamental factors such as interest expenses and taxes.
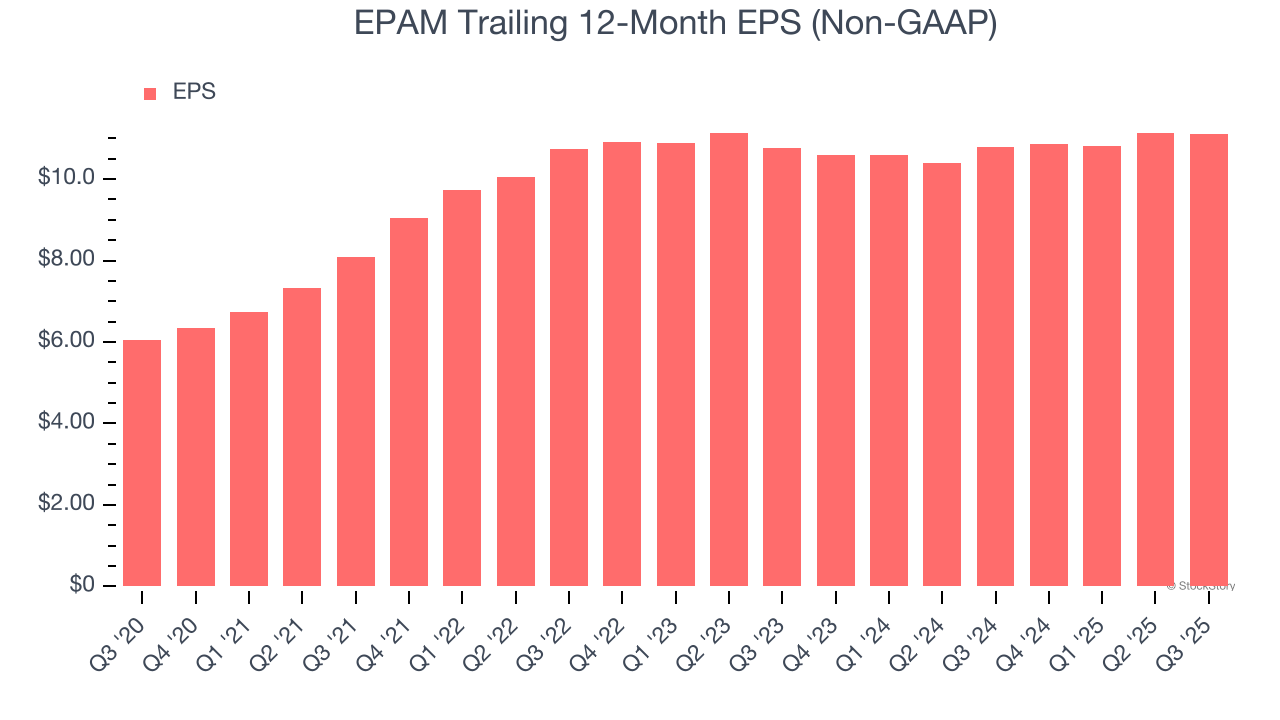
Diving into EPAM’s quality of earnings can give us a better understanding of its performance. As we mentioned earlier, EPAM’s operating margin declined by 4.9 percentage points over the last five years. This was the most relevant factor (aside from the revenue impact) behind its lower earnings; interest expenses and taxes can also affect EPS but don’t tell us as much about a company’s fundamentals.
Like with revenue, we analyze EPS over a shorter period to see if we are missing a change in the business.
For EPAM, its two-year annual EPS growth of 1.5% was lower than its five-year trend. We hope its growth can accelerate in the future.
In Q3, EPAM reported adjusted EPS of $3.08, down from $3.12 in the same quarter last year. Despite falling year on year, this print beat analysts’ estimates by 1.7%. Over the next 12 months, Wall Street expects EPAM’s full-year EPS of $11.10 to grow 7%.
Key Takeaways from EPAM’s Q3 Results
We were impressed by how significantly EPAM blew past analysts’ EPS guidance for next quarter expectations this quarter. We were also happy its full-year EPS guidance outperformed Wall Street’s estimates. On the other hand, its constant currency revenue missed. Overall, this print had some key positives. The stock traded up 5.2% to $169.20 immediately following the results.
EPAM had an encouraging quarter, but one earnings result doesn’t necessarily make the stock a buy. Let’s see if this is a good investment. If you’re making that decision, you should consider the bigger picture of valuation, business qualities, as well as the latest earnings. We cover that in our actionable full research report which you can read here, it’s free for active Edge members.


