Semiconductor maker Himax Technologies (NASDAQ: HIMX) reported revenue ahead of Wall Streets expectations in Q3 CY2025, but sales fell by 10.5% year on year to $199.2 million. Its GAAP profit of $0.01 per share was in line with analysts’ consensus estimates.
Is now the time to buy Himax? Find out by accessing our full research report, it’s free for active Edge members.
Himax (HIMX) Q3 CY2025 Highlights:
- Revenue: $199.2 million vs analyst estimates of $186.2 million (10.5% year-on-year decline, 7% beat)
- EPS (GAAP): $0.01 vs analyst estimates of $0 (in line)
- Adjusted EBITDA: $5.12 million (2.6% margin, 57% year-on-year decline)
- Operating Margin: -0.3%, down from 2.6% in the same quarter last year
- Free Cash Flow was $855,000, up from -$5.69 million in the same quarter last year
- Inventory Days Outstanding: 90, up from 83 in the previous quarter
- Market Capitalization: $1.59 billion
“Despite the limited short-term visibility in the automotive market, we remain optimistic about our automotive business outlook for the next few years, backed by our leading new technology offerings and comprehensive customer coverage. Meanwhile, we continue to focus on the expansion into emerging areas beyond display ICs, including ultralow power AI, CPO, and smart glasses, all novel applications characterized by high growth potential, high added value, and high technological barriers that are well positioned to become new growth drivers for Himax soon,” said Mr. Jordan Wu, President and Chief Executive Officer of Himax.
Company Overview
Taiwan-based Himax Technologies (NASDAQ: HIMX) is a leading manufacturer of display driver chips and timing controllers used in TVs, laptops, and mobile phones.
Revenue Growth
A company’s long-term performance is an indicator of its overall quality. Any business can put up a good quarter or two, but many enduring ones grow for years. Over the last five years, Himax grew its sales at a tepid 2% compounded annual growth rate. This was below our standards and is a rough starting point for our analysis. Semiconductors are a cyclical industry, and long-term investors should be prepared for periods of high growth followed by periods of revenue contractions.
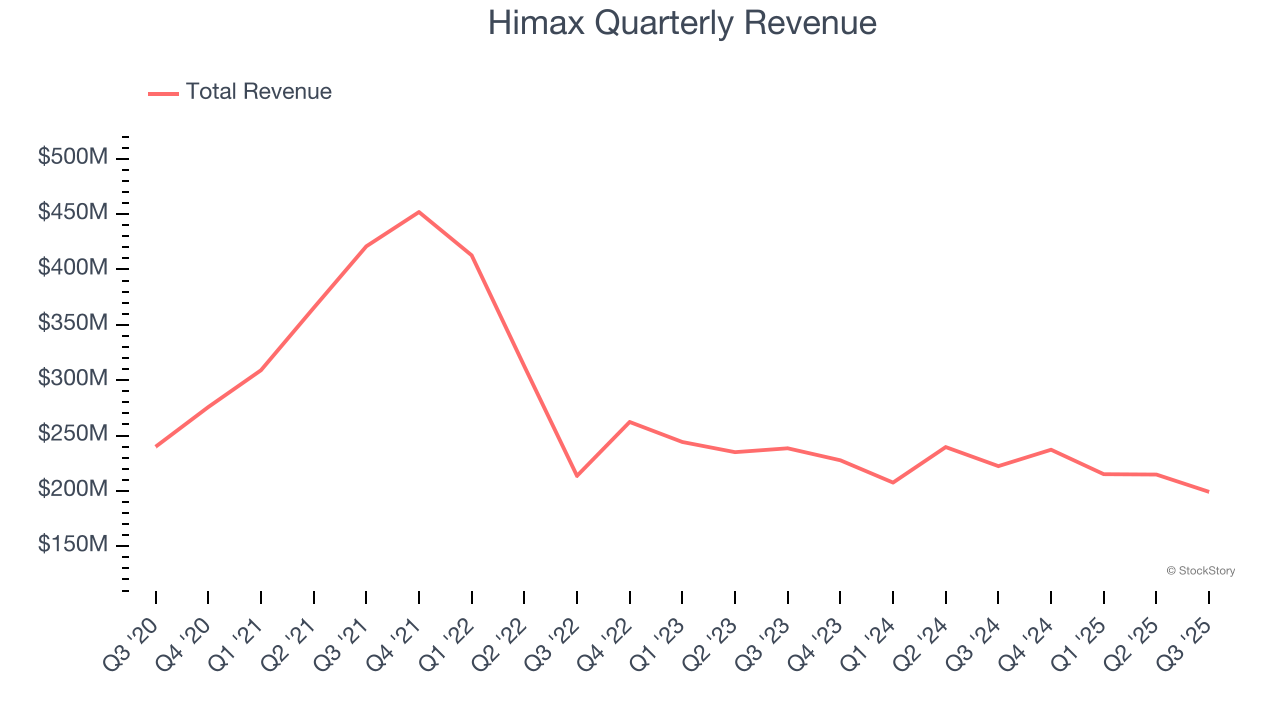
Long-term growth is the most important, but short-term results matter for semiconductors because the rapid pace of technological innovation (Moore's Law) could make yesterday's hit product obsolete today. Himax’s performance shows it grew in the past but relinquished its gains over the last two years, as its revenue fell by 6% annually. 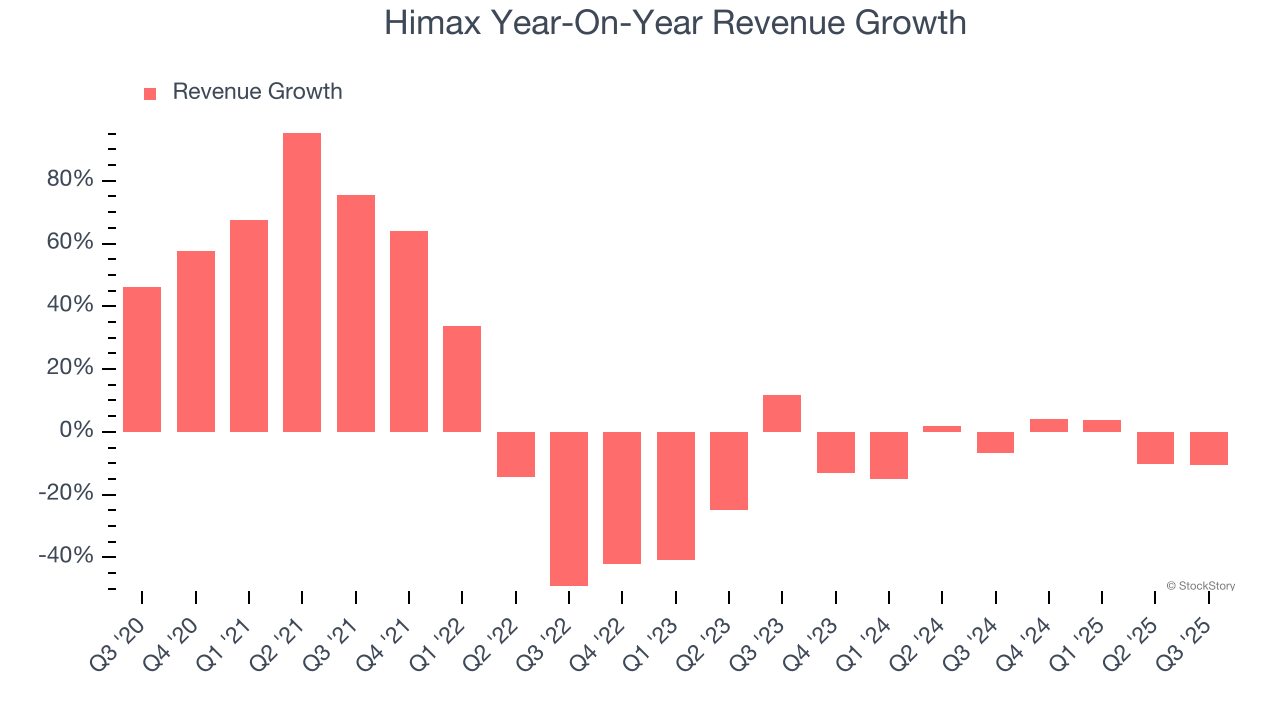
This quarter, Himax’s revenue fell by 10.5% year on year to $199.2 million but beat Wall Street’s estimates by 7%. Despite the beat, the drop in sales could mean that the current downcycle is deepening.
Looking ahead, sell-side analysts expect revenue to grow 2.7% over the next 12 months. While this projection indicates its newer products and services will catalyze better top-line performance, it is still below the sector average.
While Wall Street chases Nvidia at all-time highs, an under-the-radar semiconductor supplier is dominating a critical AI component these giants can’t build without. Click here to access our free report one of our favorites growth stories.
Product Demand & Outstanding Inventory
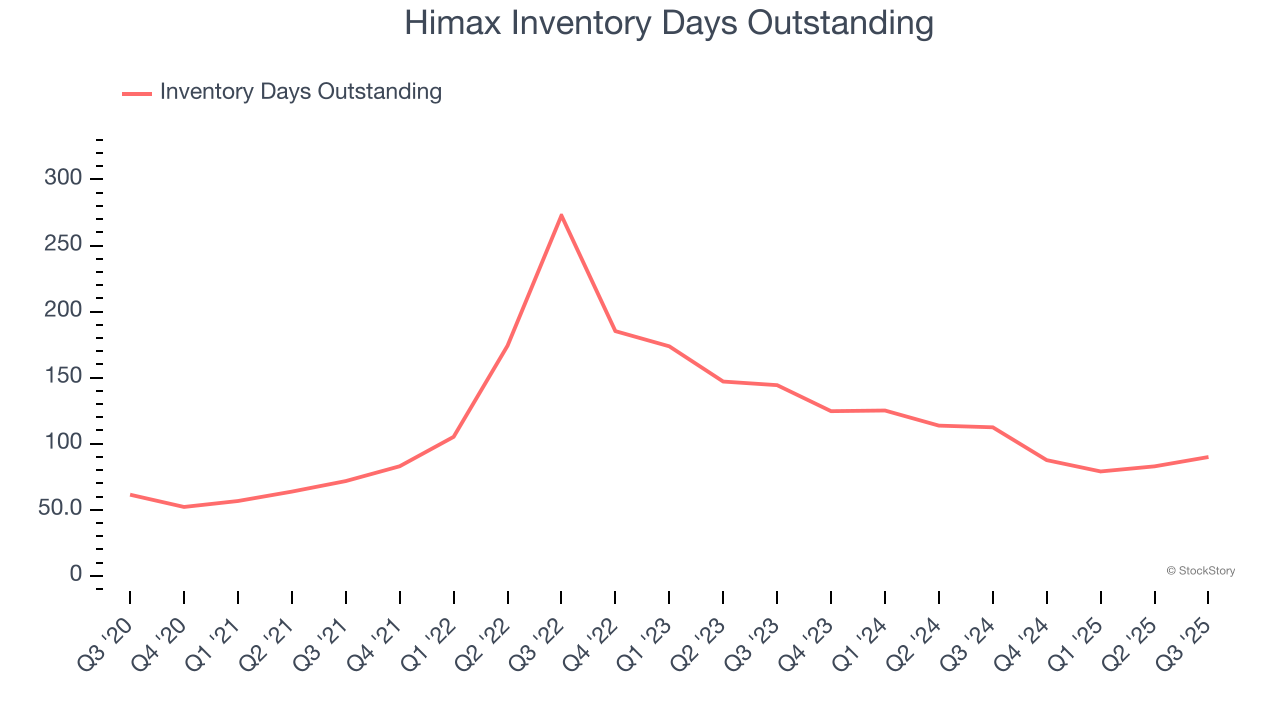
Days Inventory Outstanding (DIO) is an important metric for chipmakers, as it reflects a business’ capital intensity and the cyclical nature of semiconductor supply and demand. In a tight supply environment, inventories tend to be stable, allowing chipmakers to exert pricing power. Steadily increasing DIO can be a warning sign that demand is weak, and if inventories continue to rise, the company may have to downsize production.
This quarter, Himax’s DIO came in at 90, which is 27 days below its five-year average. These numbers show that despite the recent increase, there’s no indication of an excessive inventory buildup.
Key Takeaways from Himax’s Q3 Results
It was encouraging to see Himax meet analysts’ EPS expectations this quarter. We were also glad its revenue outperformed Wall Street’s estimates. On the other hand, its inventory levels materially increased. Zooming out, we think this was a good print with some key areas of upside. The market seemed to be hoping for more, and the stock traded down 4.1% to $8.71 immediately after reporting.
Is Himax an attractive investment opportunity right now? What happened in the latest quarter matters, but not as much as longer-term business quality and valuation, when deciding whether to invest in this stock. We cover that in our actionable full research report which you can read here, it’s free for active Edge members.