
Inclusive gym franchise company (NYSE: PLNT) beat Wall Street’s revenue expectations in Q3 CY2025, with sales up 13% year on year to $330.3 million. Its non-GAAP profit of $0.80 per share was 8.2% above analysts’ consensus estimates.
Is now the time to buy Planet Fitness? Find out by accessing our full research report, it’s free for active Edge members.
Planet Fitness (PLNT) Q3 CY2025 Highlights:
- Revenue: $330.3 million vs analyst estimates of $324 million (13% year-on-year growth, 2% beat)
- Adjusted EPS: $0.80 vs analyst estimates of $0.74 (8.2% beat)
- Adjusted EBITDA: $140.8 million vs analyst estimates of $137.2 million (42.6% margin, 2.6% beat)
- Operating Margin: 32.4%, up from 27.8% in the same quarter last year
- Free Cash Flow Margin: 23.2%, down from 26.7% in the same quarter last year
- Same-Store Sales rose 6.9% year on year (4.3% in the same quarter last year)
- Market Capitalization: $7.70 billion
"We are making significant progress in executing on our long-term strategy, as highlighted by our strong financial performance during the quarter, which enabled us to raise certain growth targets for our 2025 outlook," said Colleen Keating, Chief Executive Officer.
Company Overview
Founded by two brothers who purchased a struggling gym, Planet Fitness (NYSE: PLNT) is a gym franchise that caters to casual fitness users by providing a friendly and inclusive atmosphere.
Revenue Growth
A company’s long-term sales performance is one signal of its overall quality. Any business can experience short-term success, but top-performing ones enjoy sustained growth for years. Over the last five years, Planet Fitness grew its sales at an impressive 22.6% compounded annual growth rate. Its growth beat the average consumer discretionary company and shows its offerings resonate with customers.

Long-term growth is the most important, but within consumer discretionary, product cycles are short and revenue can be hit-driven due to rapidly changing trends and consumer preferences. Planet Fitness’s recent performance shows its demand has slowed significantly as its annualized revenue growth of 9.9% over the last two years was well below its five-year trend. Note that COVID hurt Planet Fitness’s business in 2020 and part of 2021, and it bounced back in a big way thereafter. 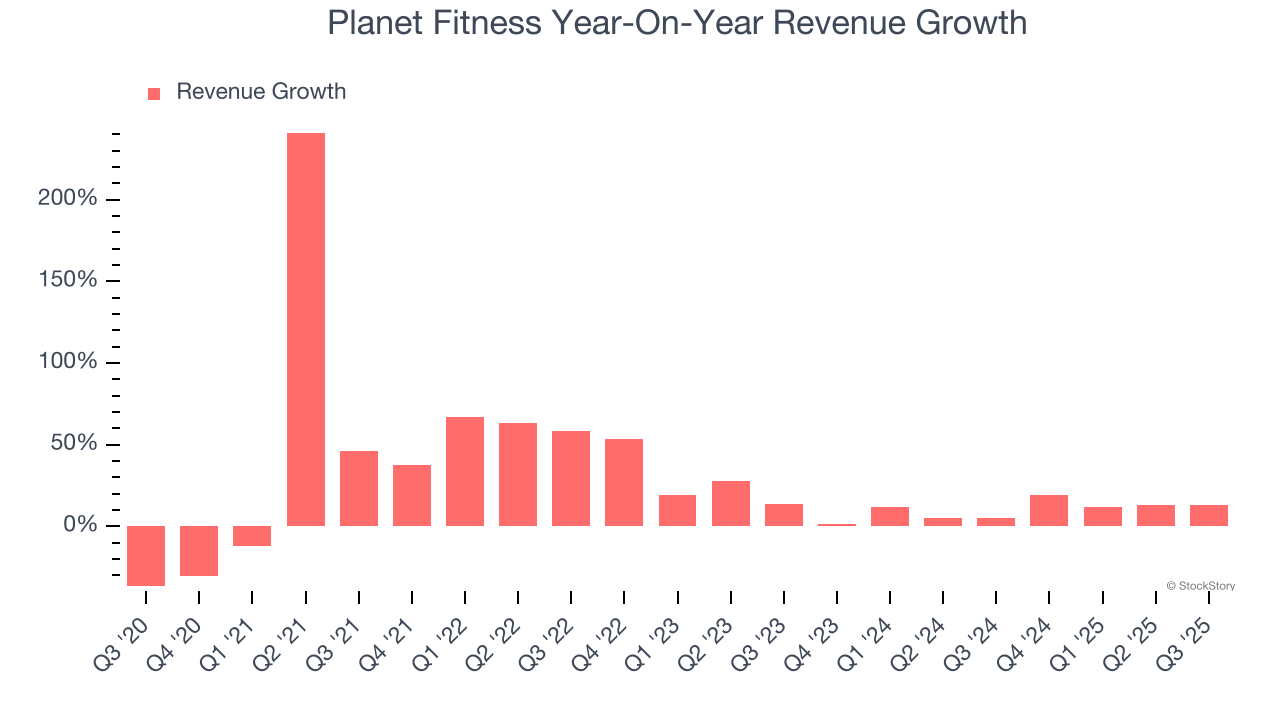
We can dig further into the company’s revenue dynamics by analyzing its same-store sales, which show how much revenue its established locations generate. Over the last two years, Planet Fitness’s same-store sales averaged 6.1% year-on-year growth. Because this number is lower than its revenue growth, we can see the opening of new locations is boosting the company’s top-line performance. 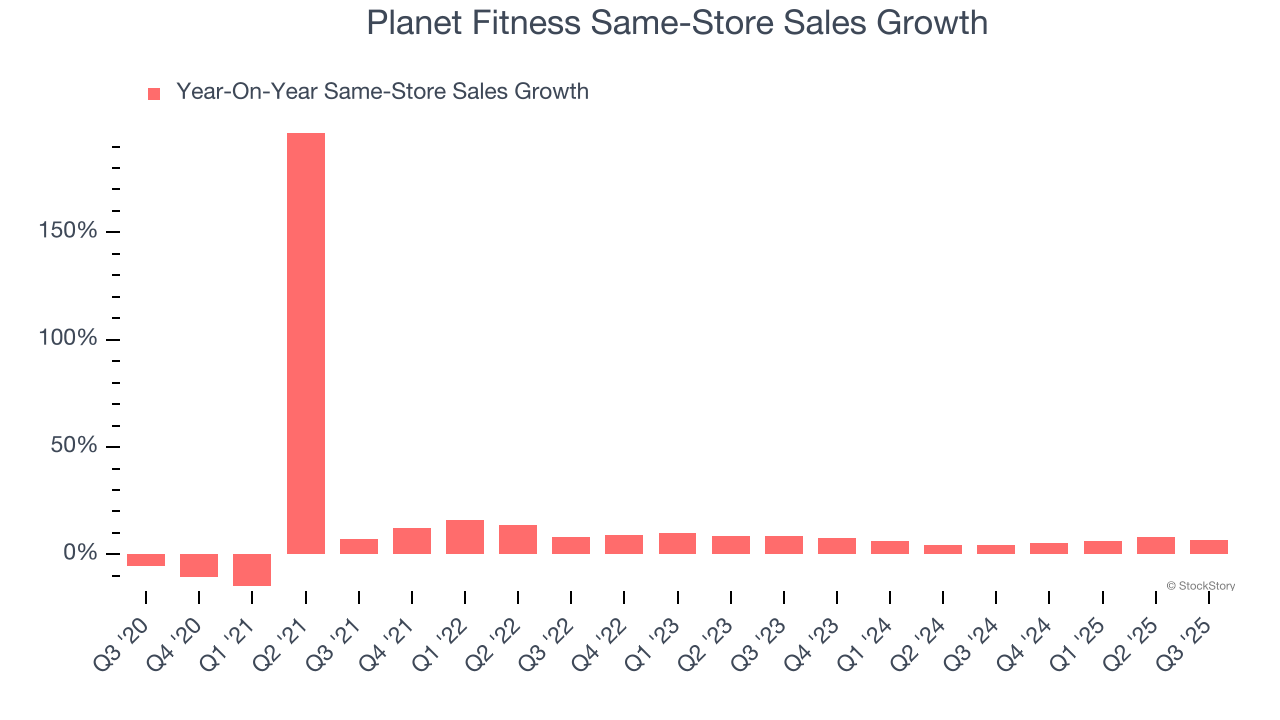
This quarter, Planet Fitness reported year-on-year revenue growth of 13%, and its $330.3 million of revenue exceeded Wall Street’s estimates by 2%.
Looking ahead, sell-side analysts expect revenue to grow 8.5% over the next 12 months, similar to its two-year rate. This projection is underwhelming and indicates its products and services will face some demand challenges.
Microsoft, Alphabet, Coca-Cola, Monster Beverage—all began as under-the-radar growth stories riding a massive trend. We’ve identified the next one: a profitable AI semiconductor play Wall Street is still overlooking. Go here for access to our full report.
Operating Margin
Operating margin is an important measure of profitability as it shows the portion of revenue left after accounting for all core expenses – everything from the cost of goods sold to advertising and wages. It’s also useful for comparing profitability across companies with different levels of debt and tax rates because it excludes interest and taxes.
Planet Fitness’s operating margin has risen over the last 12 months and averaged 28.3% over the last two years. On top of that, its profitability was elite for a consumer discretionary business thanks to its efficient cost structure and economies of scale.
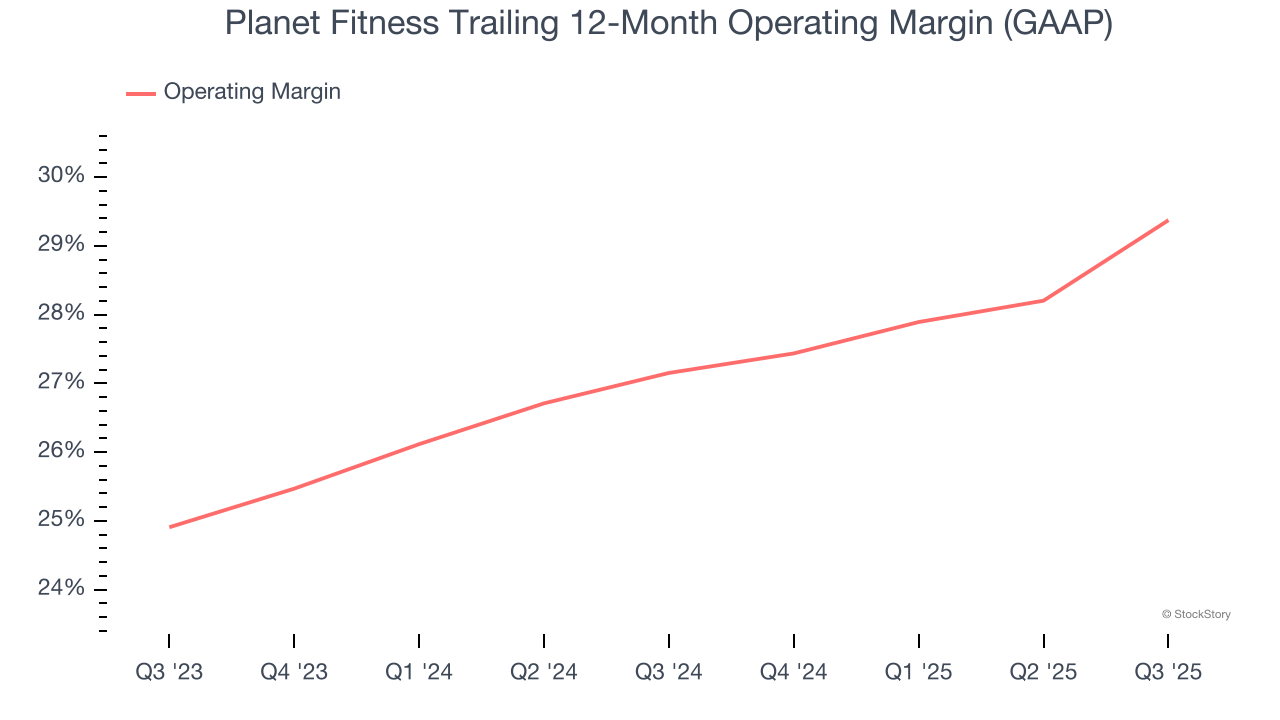
This quarter, Planet Fitness generated an operating margin profit margin of 32.4%, up 4.6 percentage points year on year. This increase was a welcome development and shows it was more efficient.
Earnings Per Share
Revenue trends explain a company’s historical growth, but the long-term change in earnings per share (EPS) points to the profitability of that growth – for example, a company could inflate its sales through excessive spending on advertising and promotions.
Planet Fitness’s EPS grew at an astounding 58% compounded annual growth rate over the last five years, higher than its 22.6% annualized revenue growth. This tells us the company became more profitable on a per-share basis as it expanded.
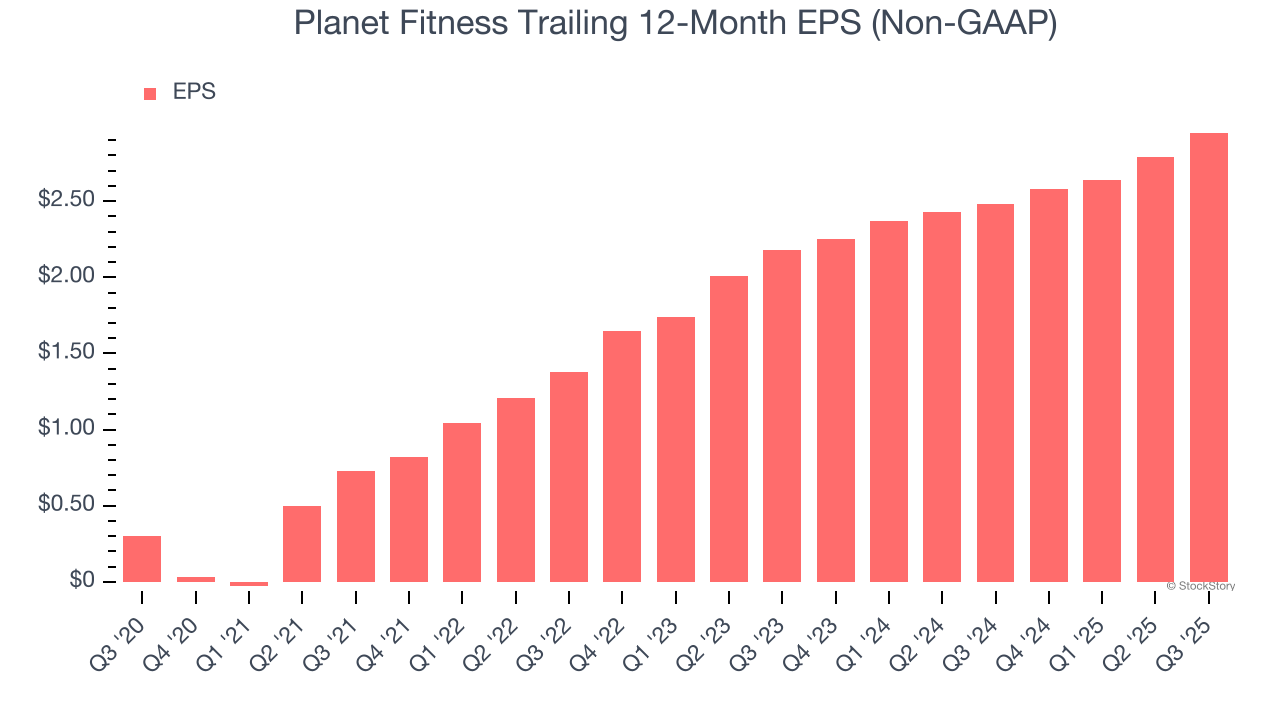
In Q3, Planet Fitness reported adjusted EPS of $0.80, up from $0.64 in the same quarter last year. This print beat analysts’ estimates by 8.2%. Over the next 12 months, Wall Street expects Planet Fitness’s full-year EPS of $2.95 to grow 12.8%.
Key Takeaways from Planet Fitness’s Q3 Results
It was good to see Planet Fitness narrowly top analysts’ same-store sales expectations this quarter. We were also glad its EPS outperformed Wall Street’s estimates. Overall, this print had some key positives. The stock traded up 6.9% to $98 immediately following the results.
Planet Fitness had an encouraging quarter, but one earnings result doesn’t necessarily make the stock a buy. Let’s see if this is a good investment. We think that the latest quarter is only one piece of the longer-term business quality puzzle. Quality, when combined with valuation, can help determine if the stock is a buy. We cover that in our actionable full research report which you can read here, it’s free for active Edge members.